Carbon Visuals helped make sense of big environmental challenges – climate change, air pollution, water and resource use. At the personal, local or global level.
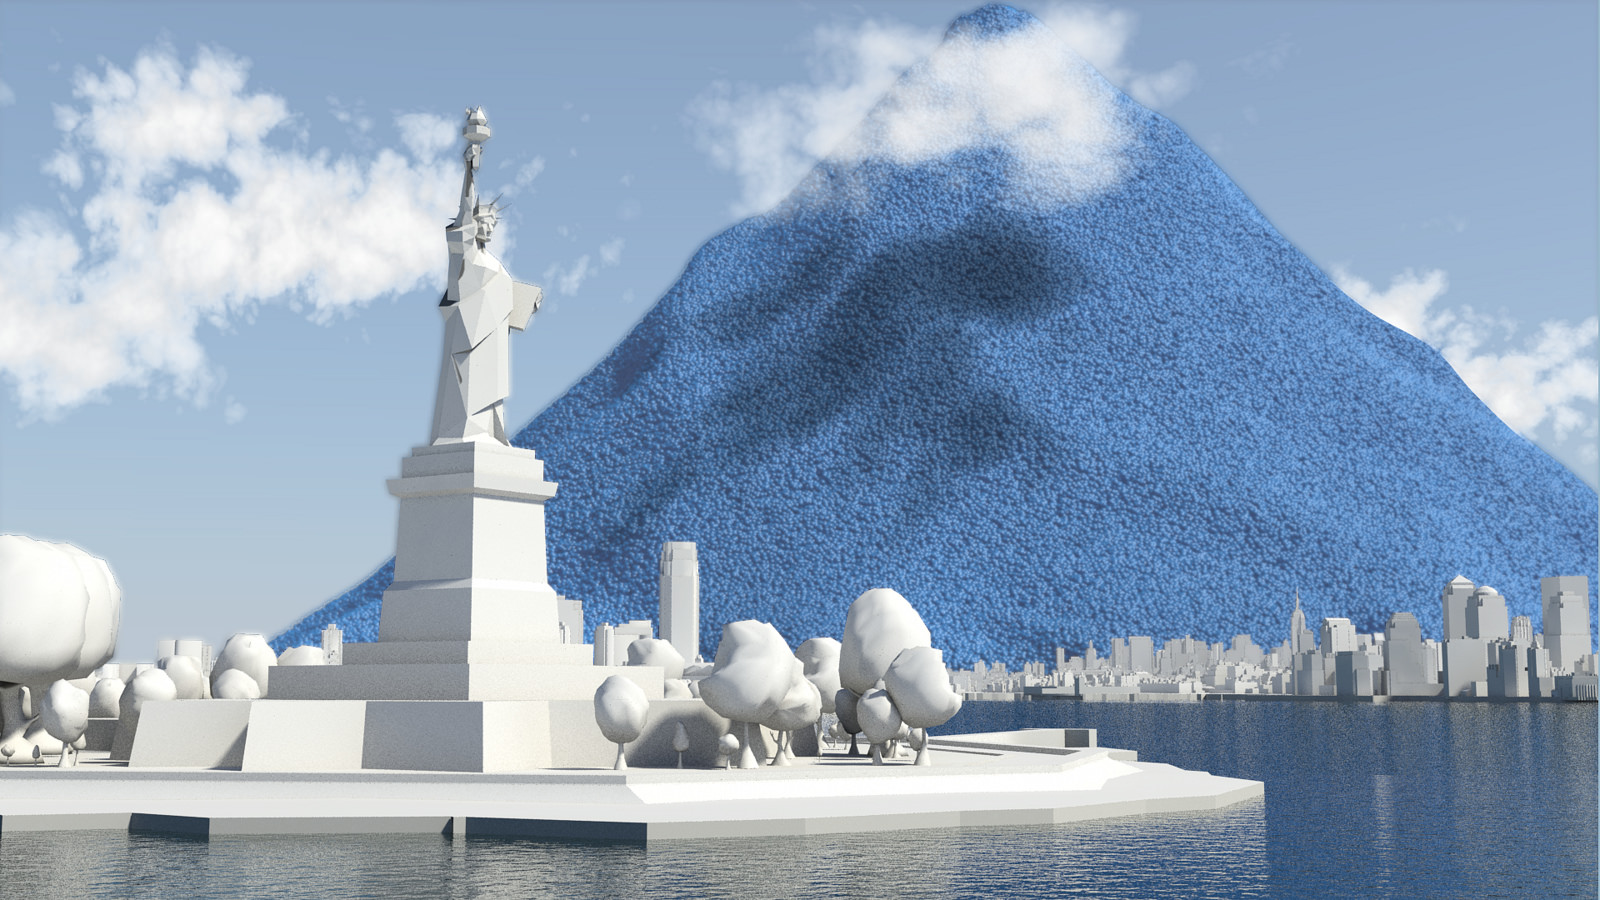
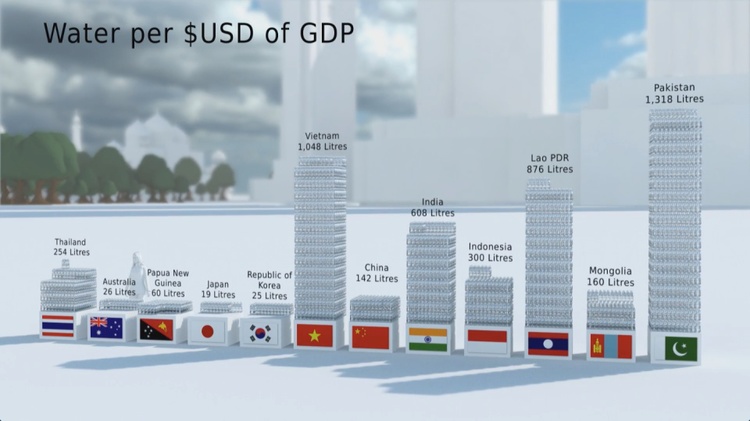
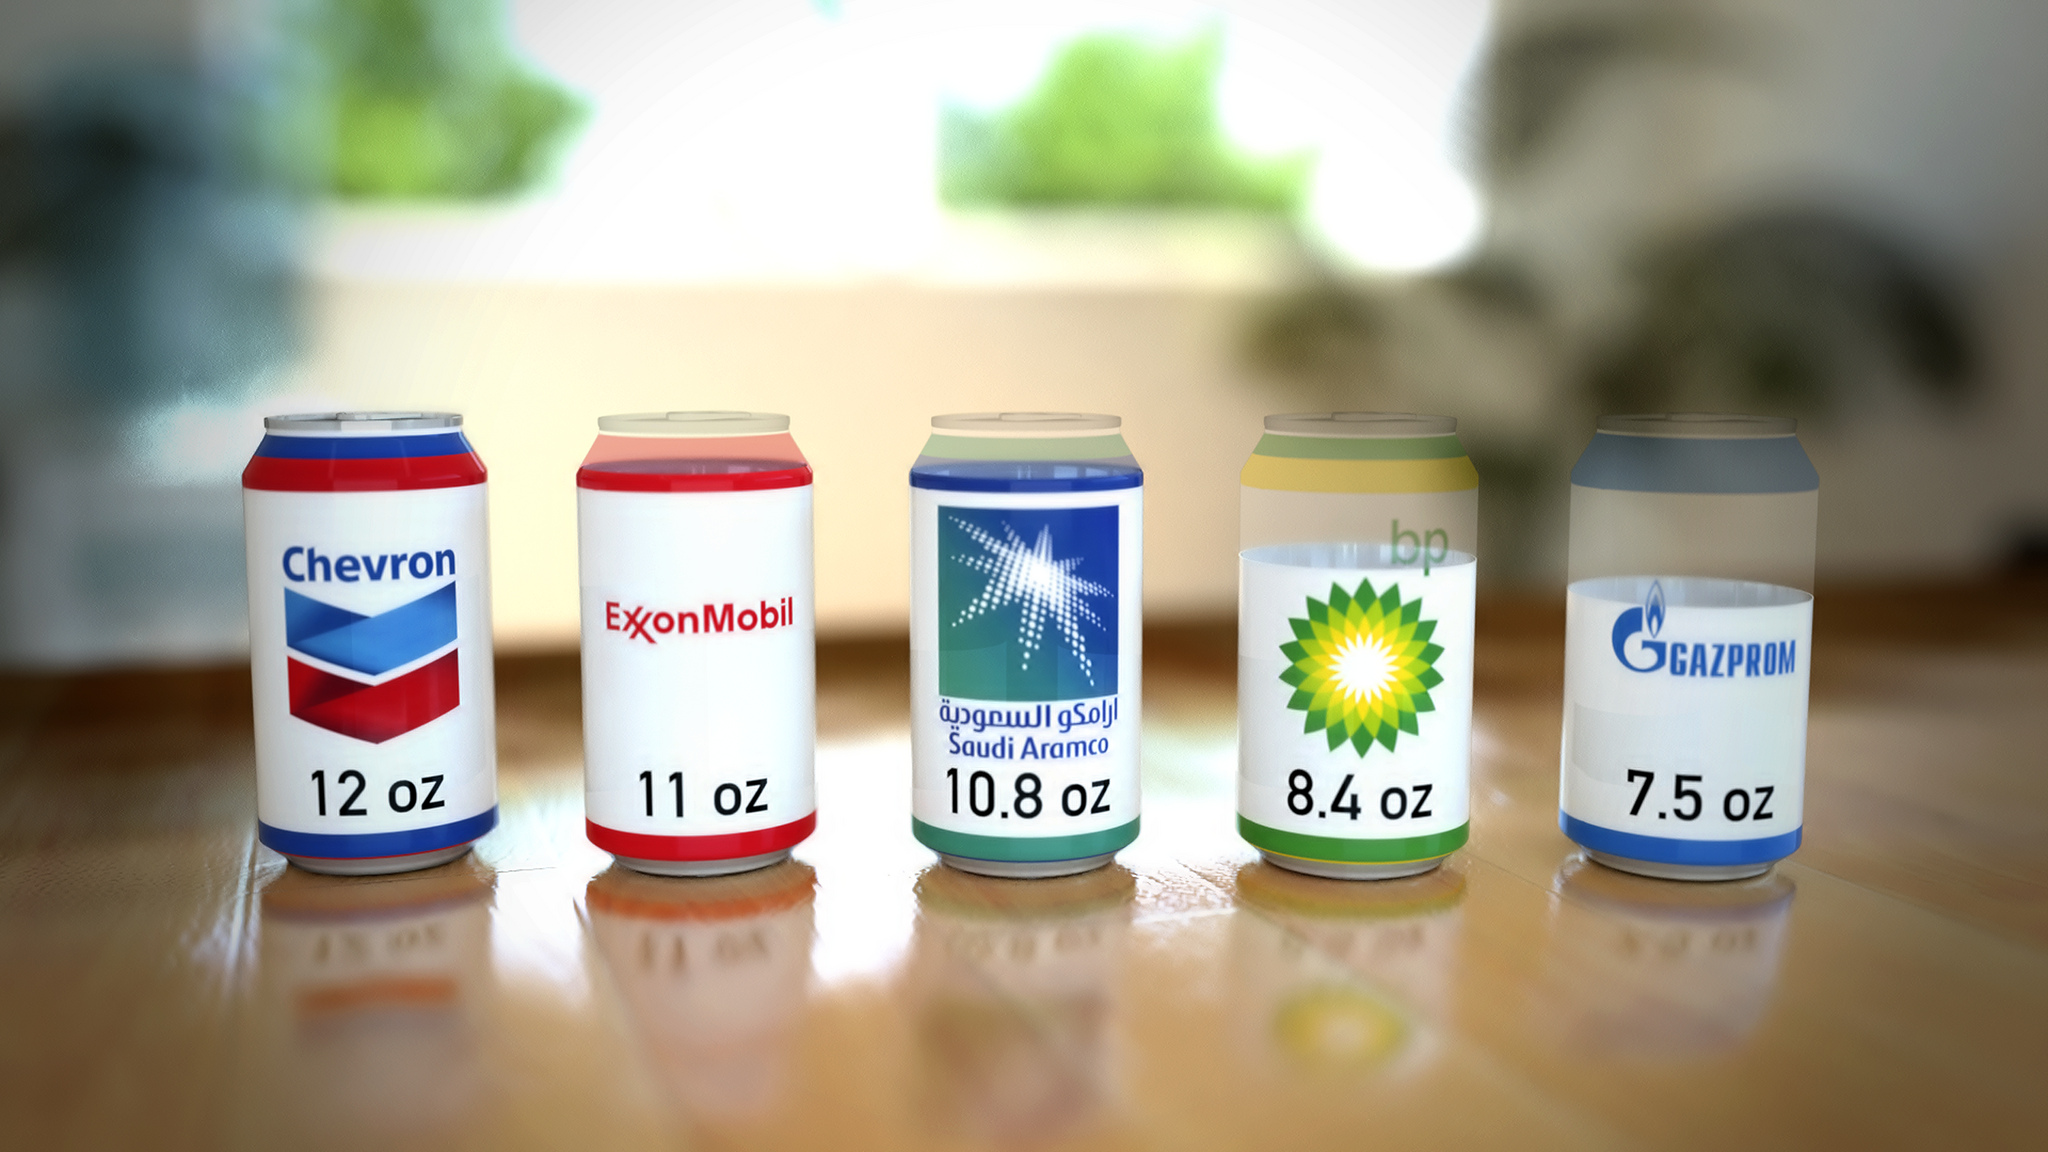
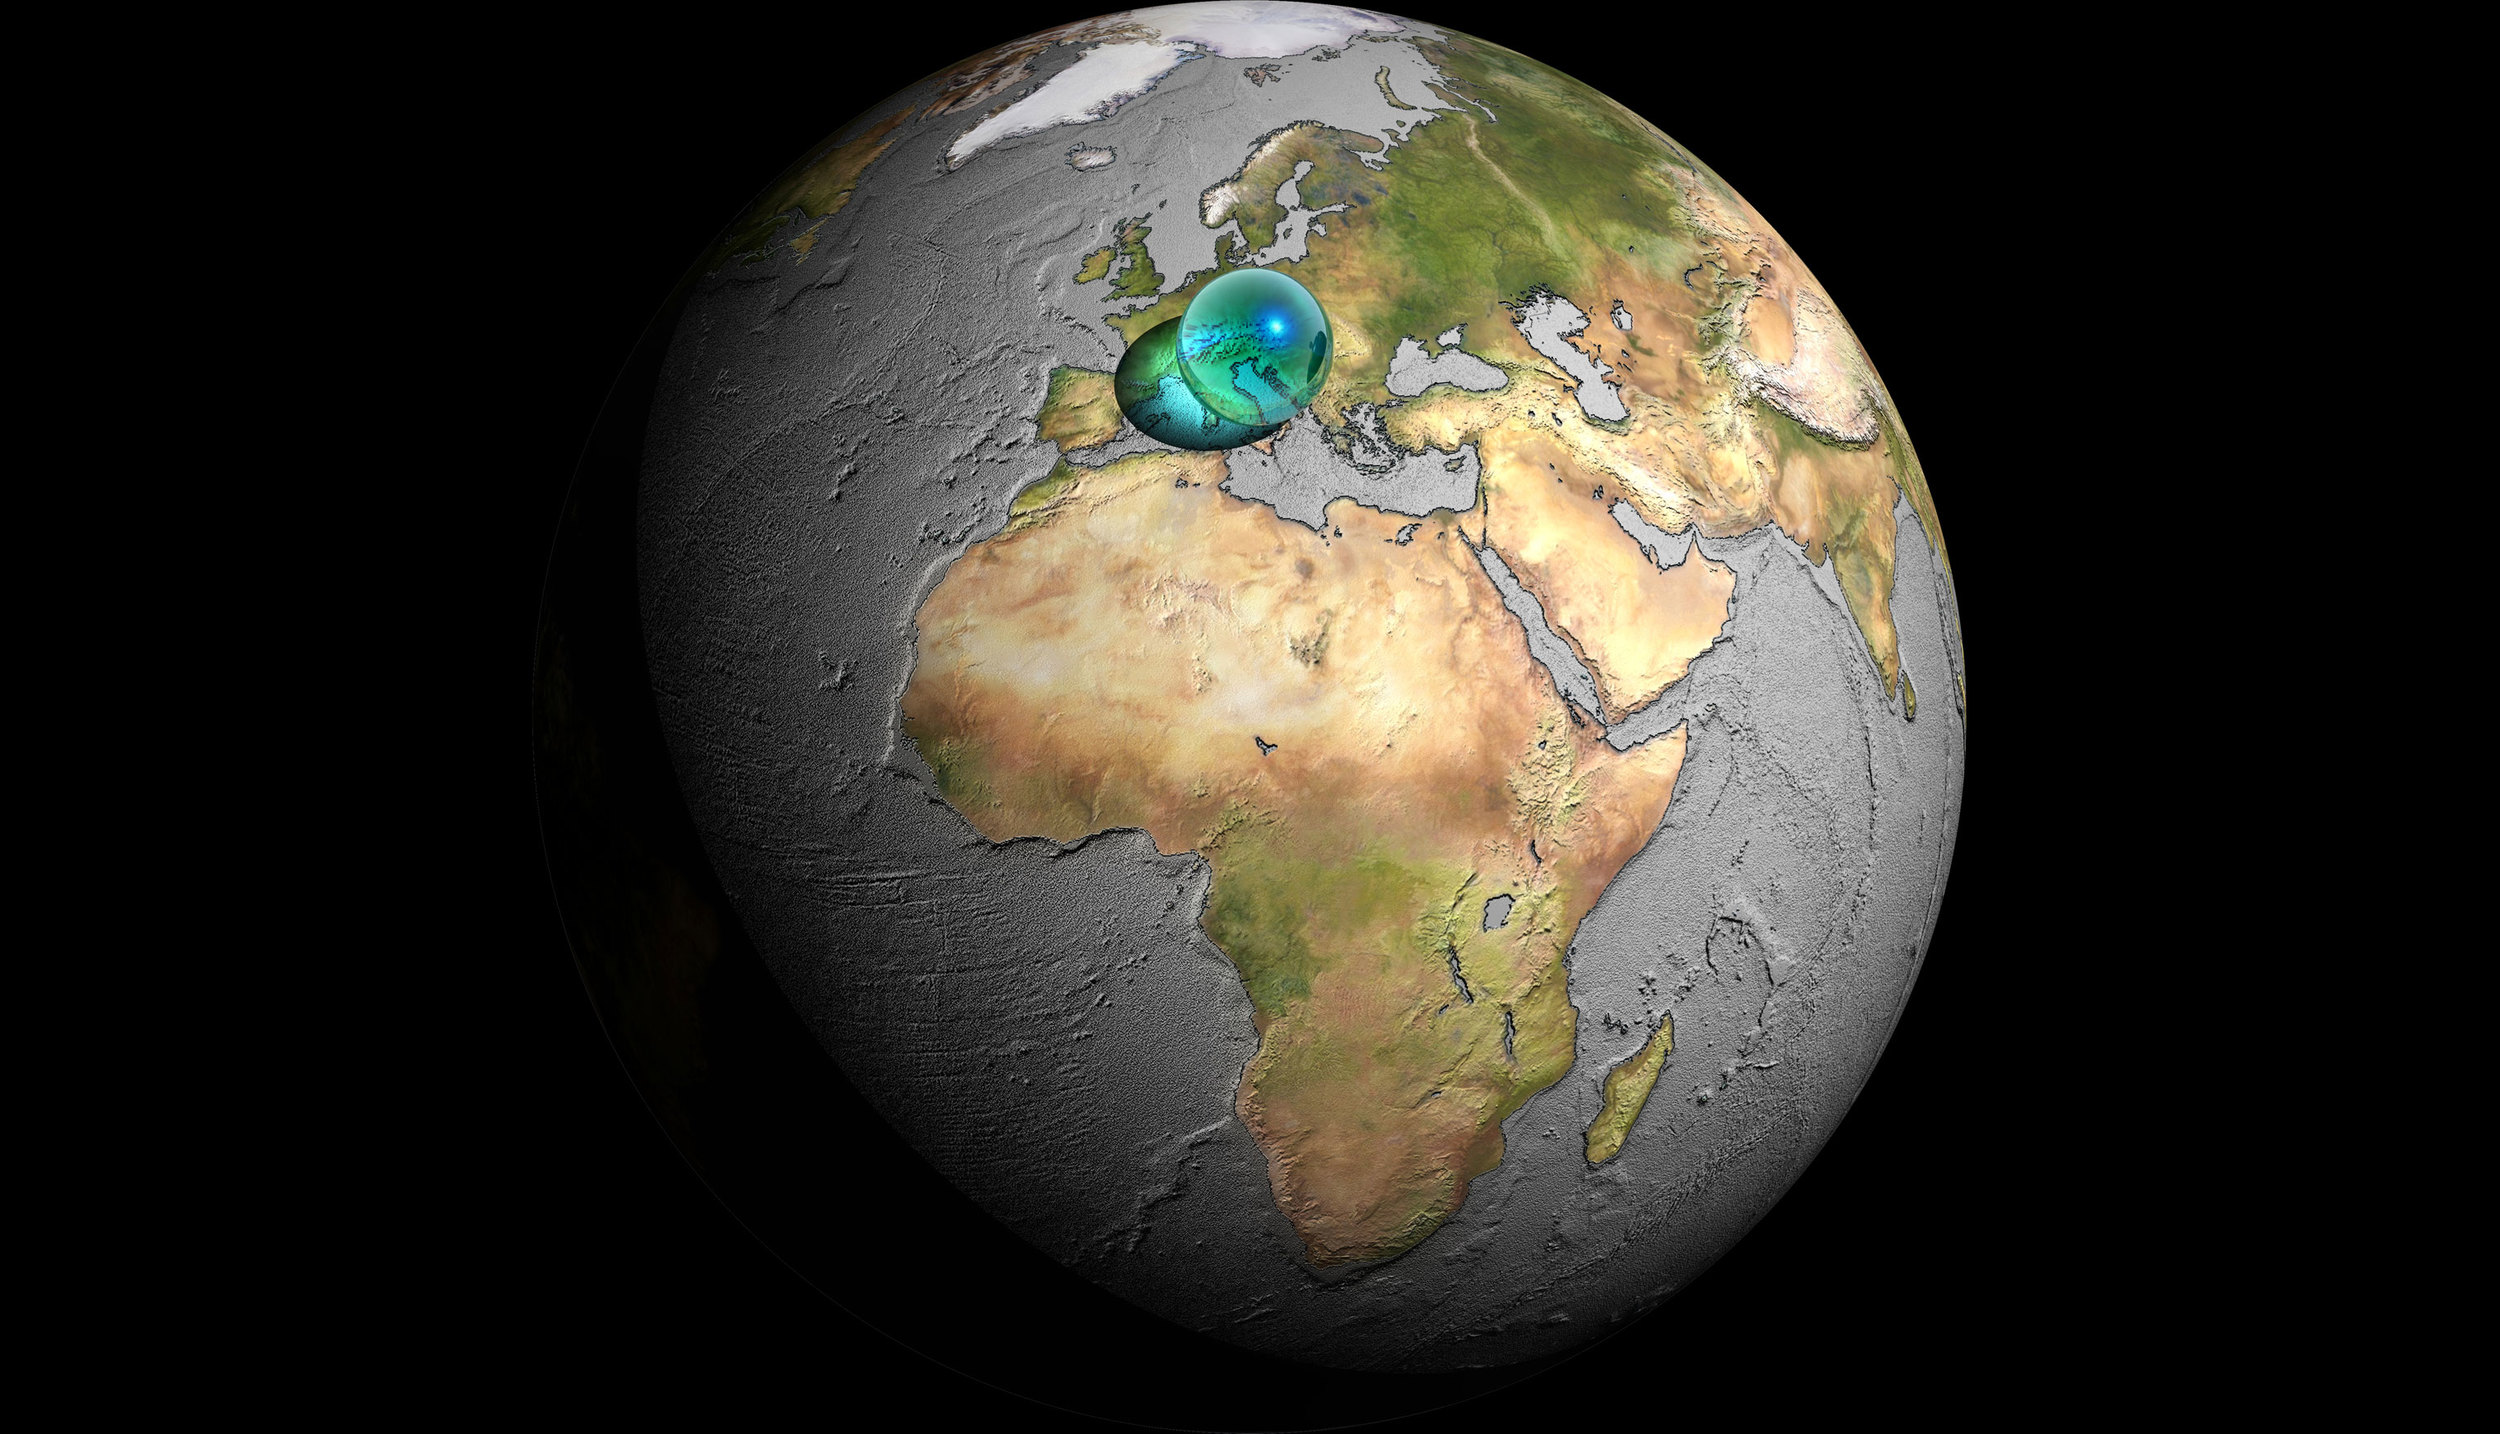
We turned data into dimensionally accurate volumes in familiar landscapes. People could see it is real and not just abstract numbers.
Carbon Visuals was formed as a joint venture between two companies - CarbonSense Ltd and GovEd Communications Ltd. The company has ceased trading.
The operational team from Carbon Visuals have joined with new colleagues to establish Real World Visuals.