CLIENT
University of Plymouth
PURPOSE
To engage students, academics and staff, show emissions are real and that the University is endeavouring to achieve reductions.
DESCRIPTION
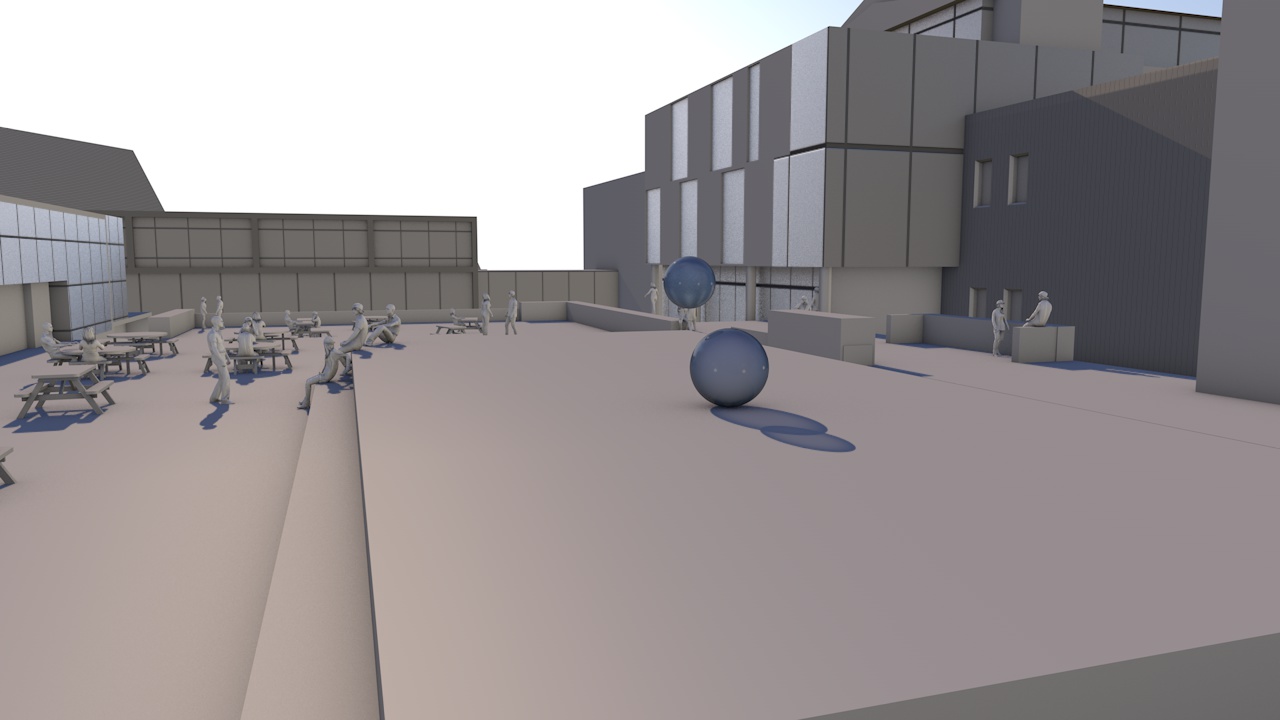
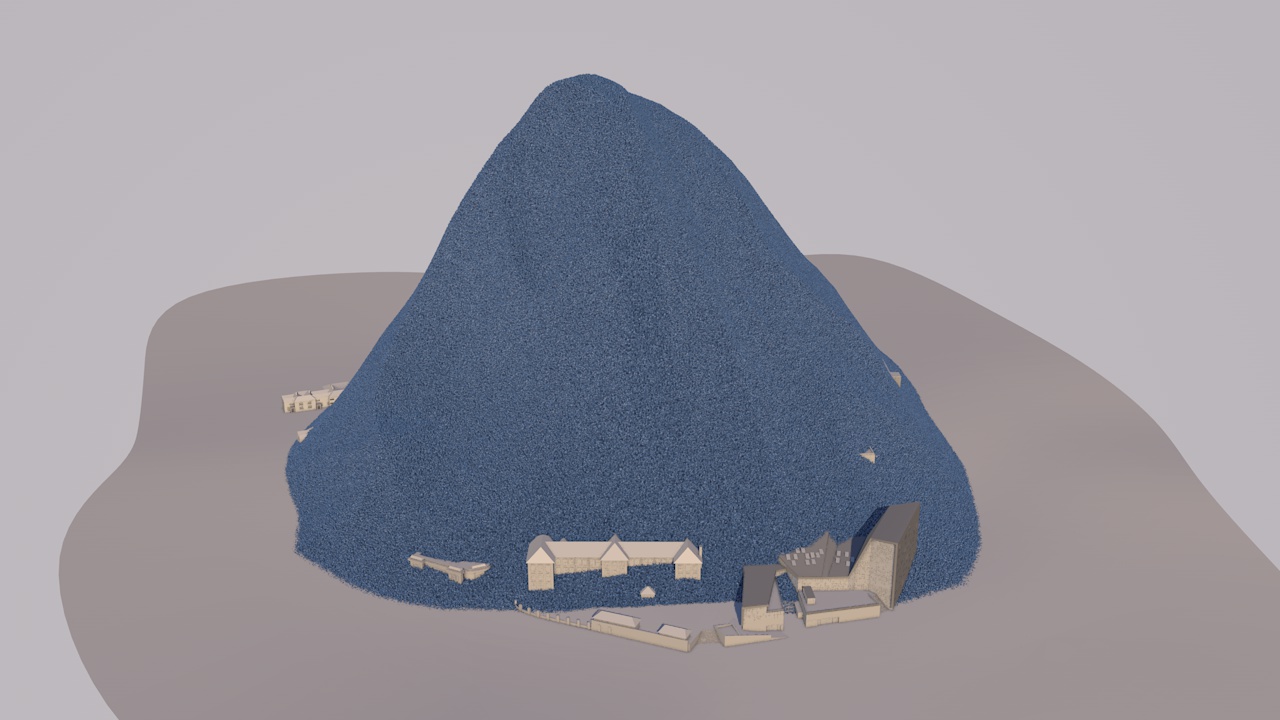
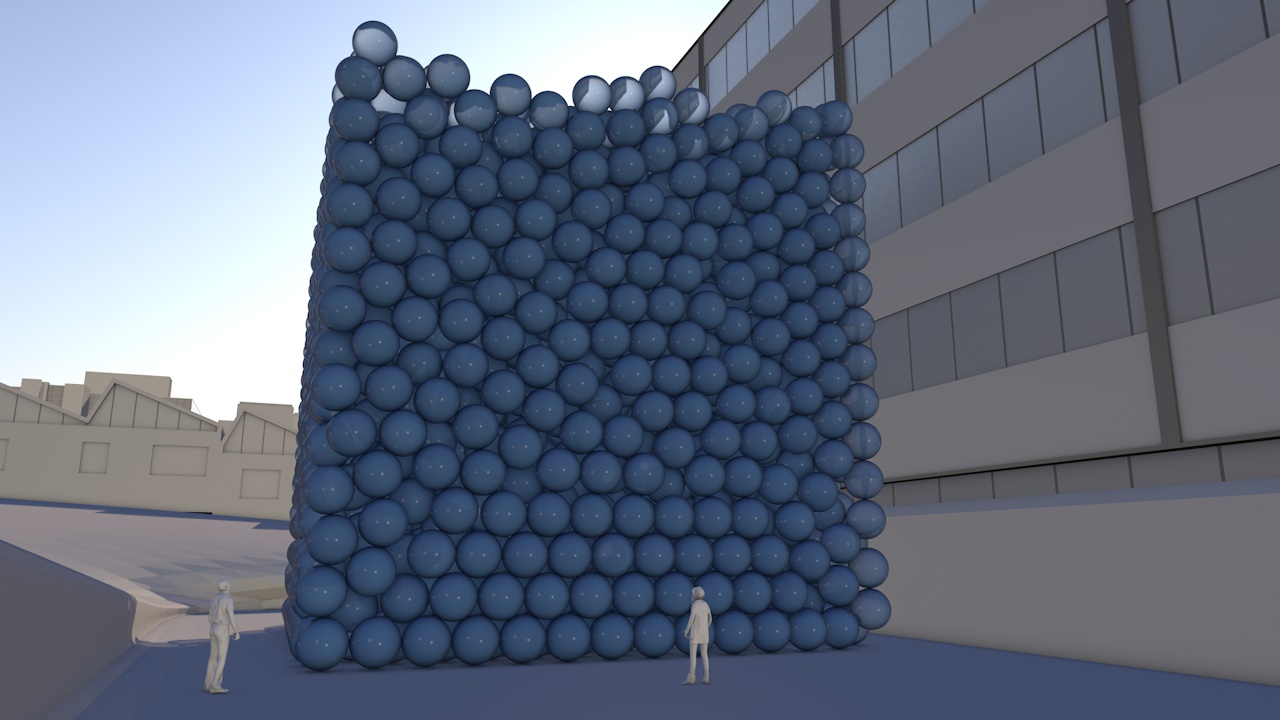
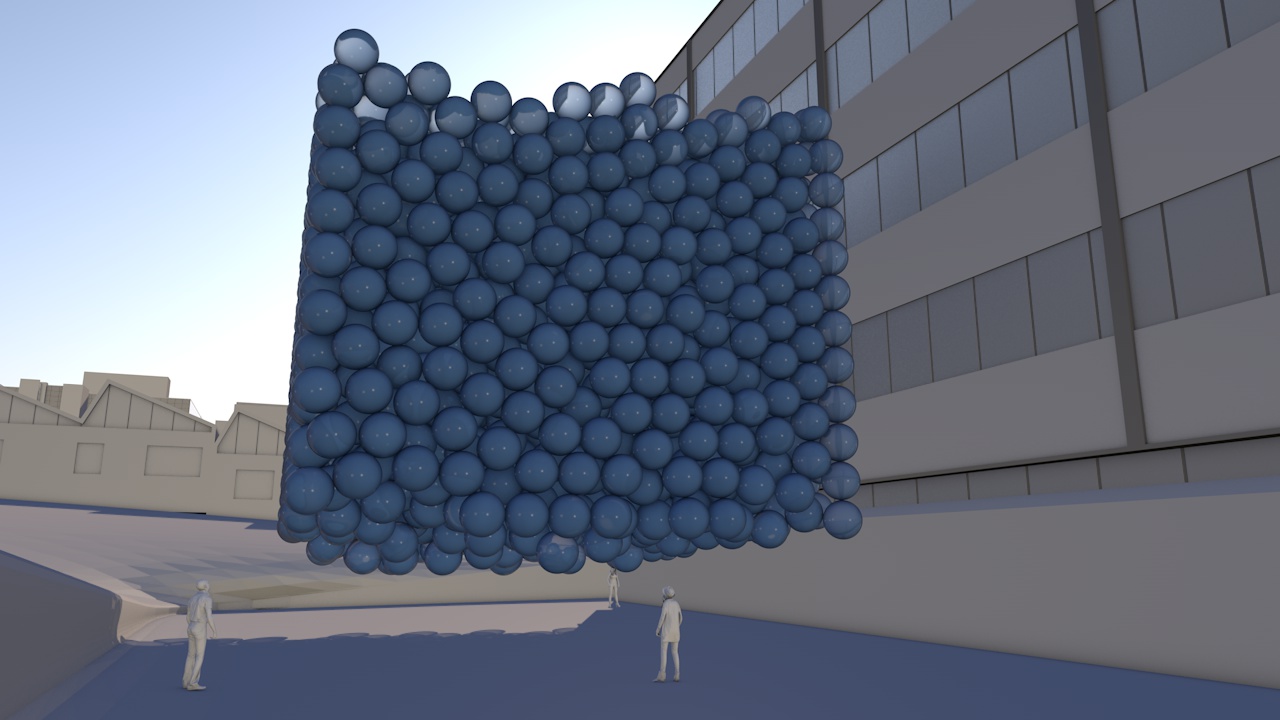
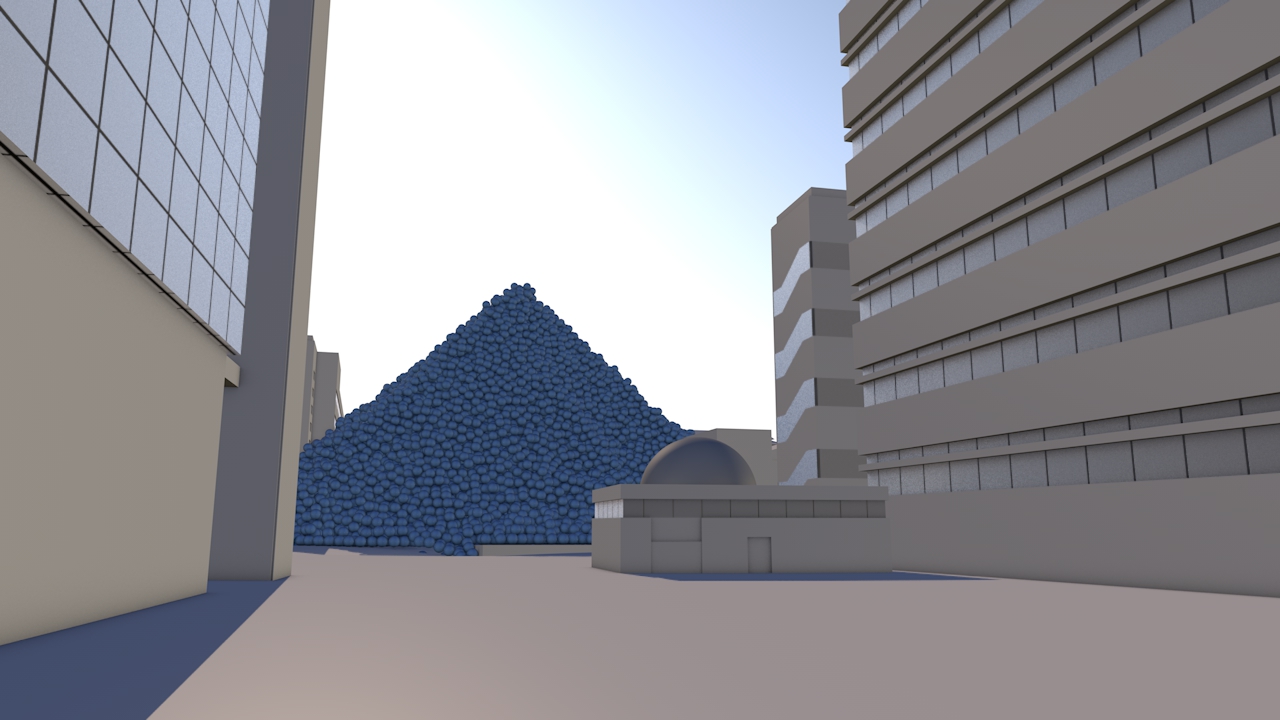
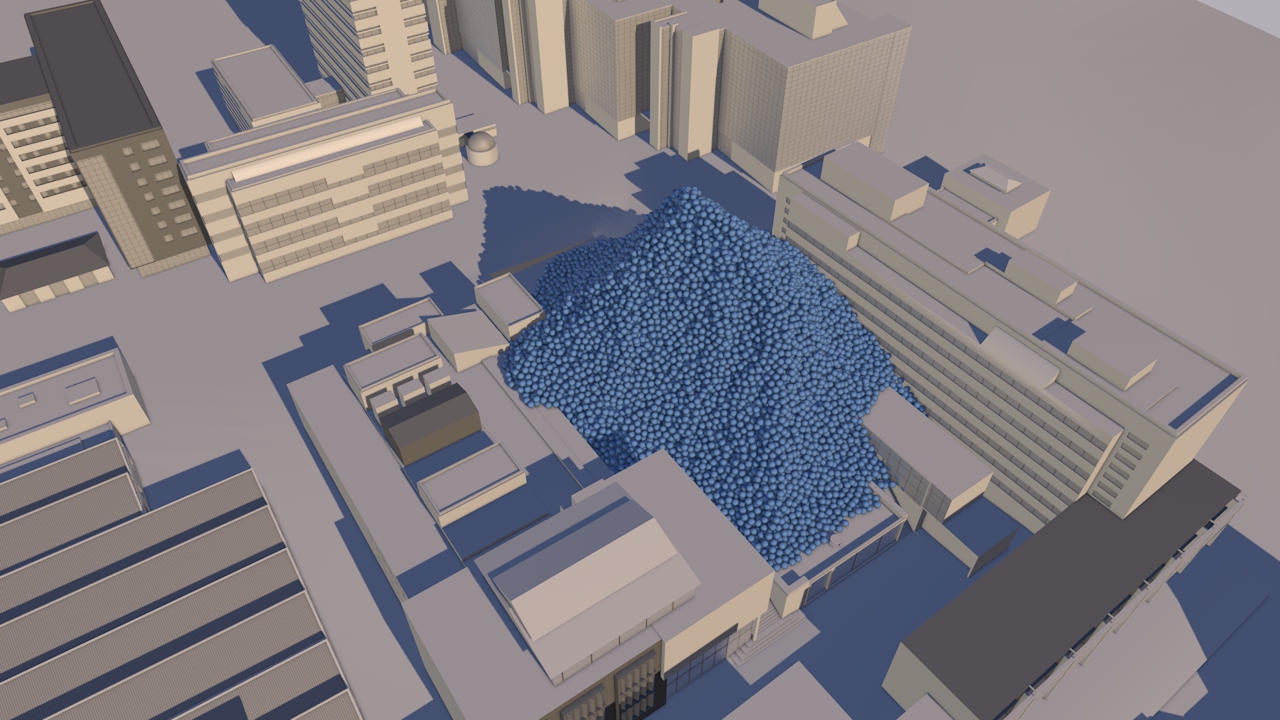
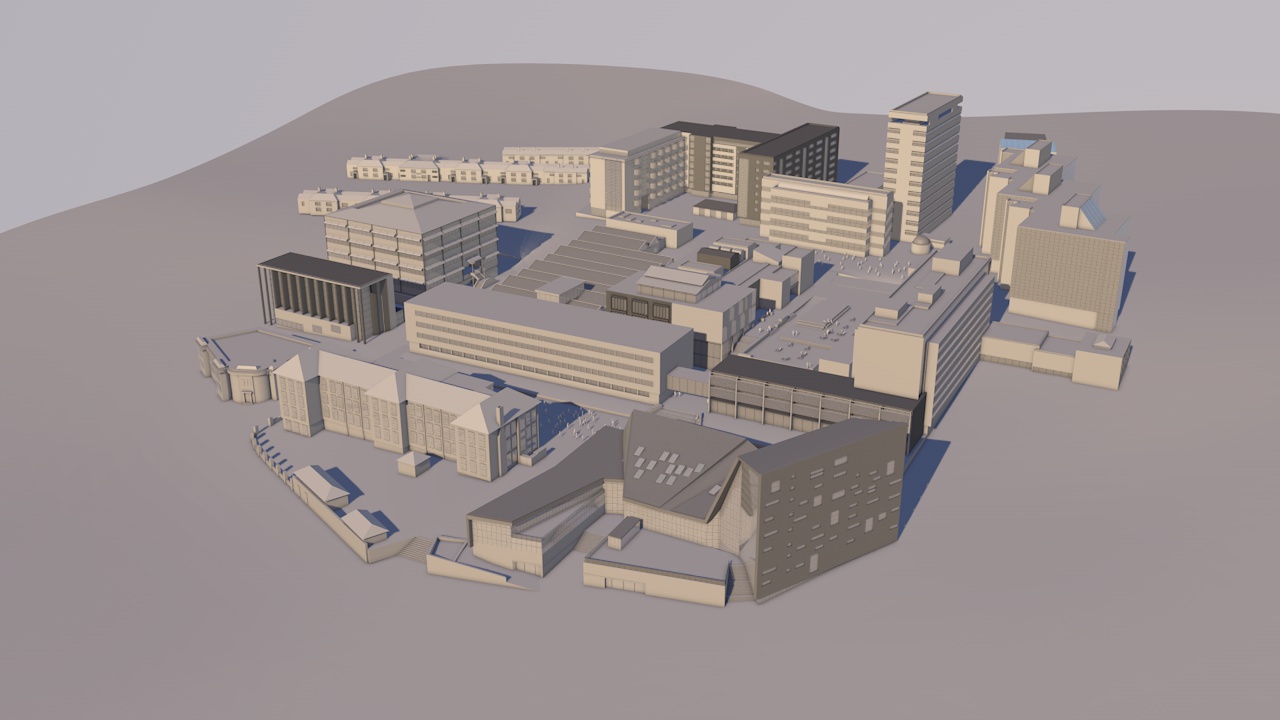
Animation showing the footprint using the campus itself for scale and including a success story where emissions have been reduced.
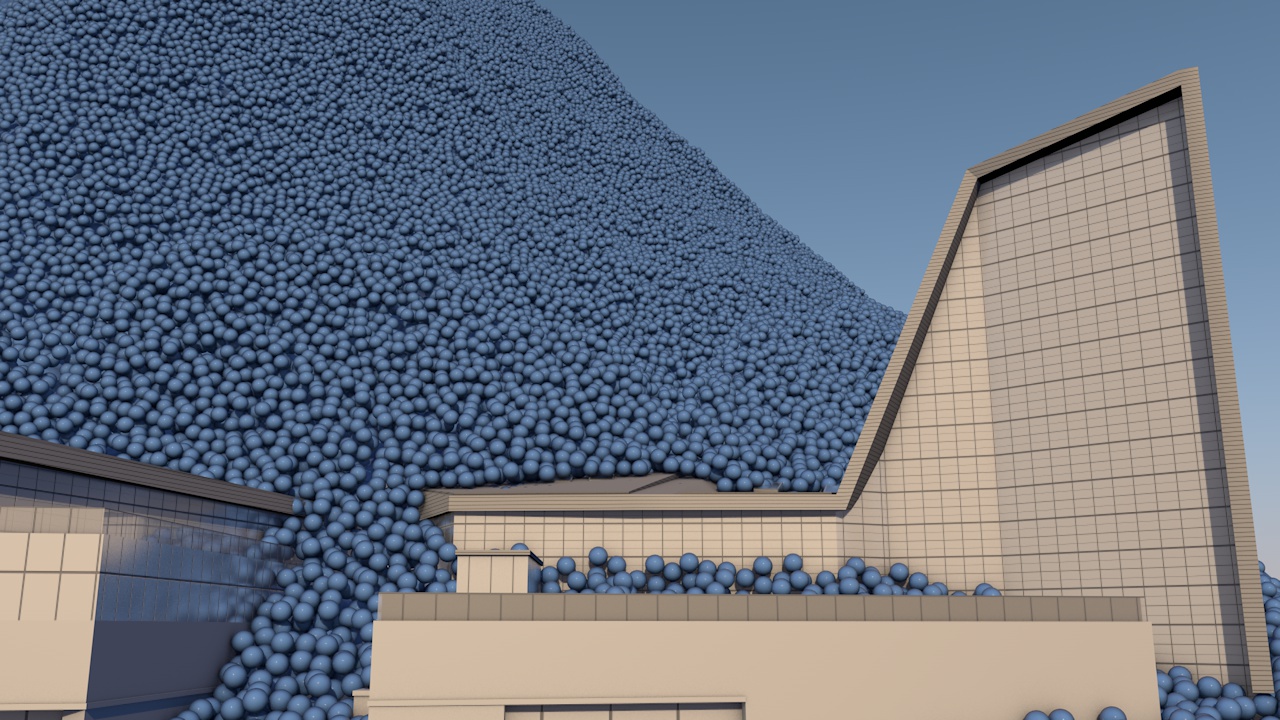
The University of Plymouth adds 11 thousand tonnes of carbon dioxide to the atmosphere every year. But what does that look like?
This animated film illustrates this footprint using the campus itself for scale and shows a ‘success’ story’ where emissions have been reduced.
The purpose of the video was to engage otherwise uninterested students, academics and staff, get them to realise that carbon emissions are real and show that the university is endeavouring to achieve measurable reductions. The intention is then to invite them to explore more detail through web-based energy and carbon dashboard.
The annual carbon reduction savings of 213,890 KgCO2e were achieved at the Babbage building after lighting and IT upgrade, installing voltage optimisation and connection to the Combined Heat & Power (CHP) plant. These savings are expected to equate to the annual emissions of the new Marine Building.
FURTHER INFORMATION
University of Plymouth Carbon Management Plan 2010 - 2015 here.
Sustainability pages for Plymouth University here.

