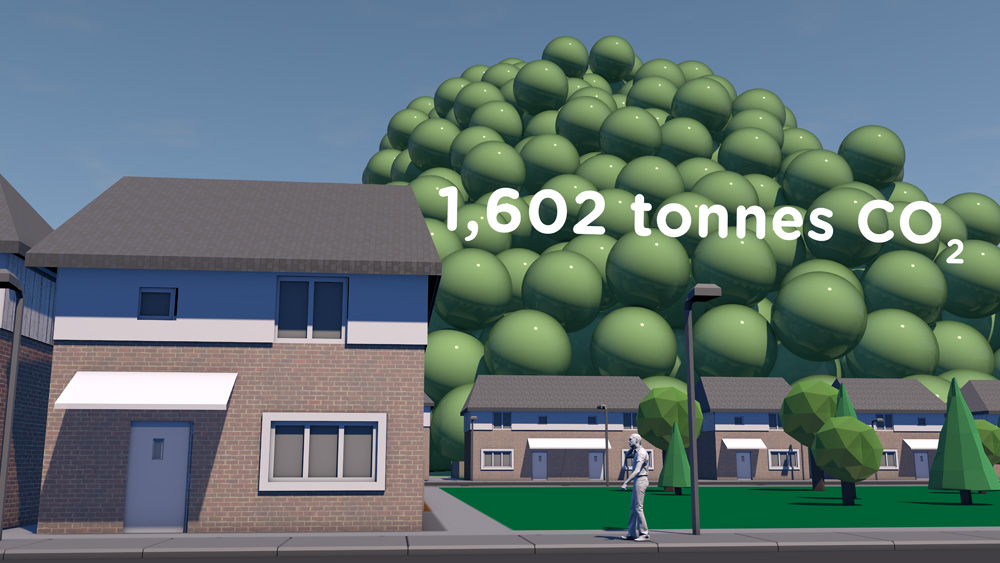
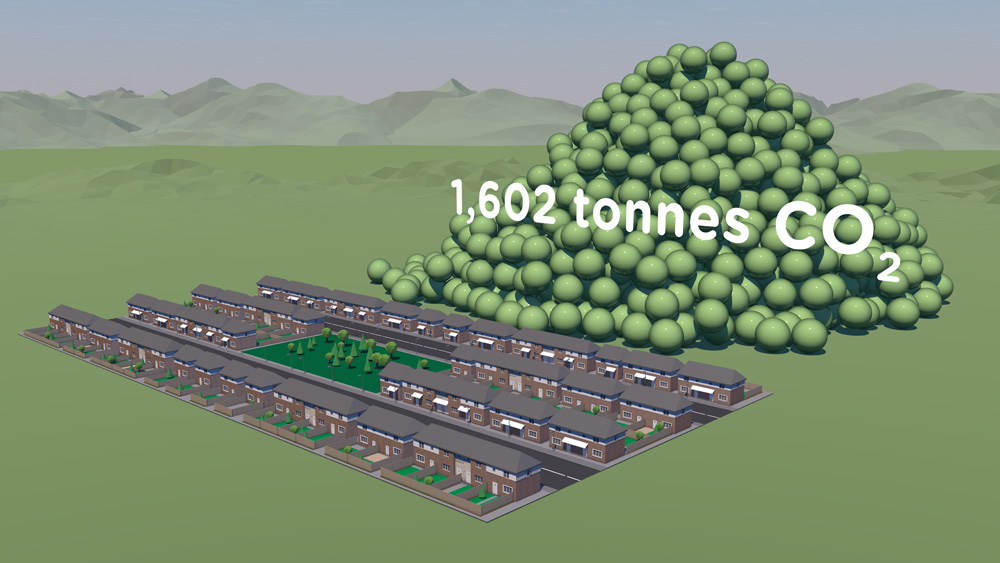
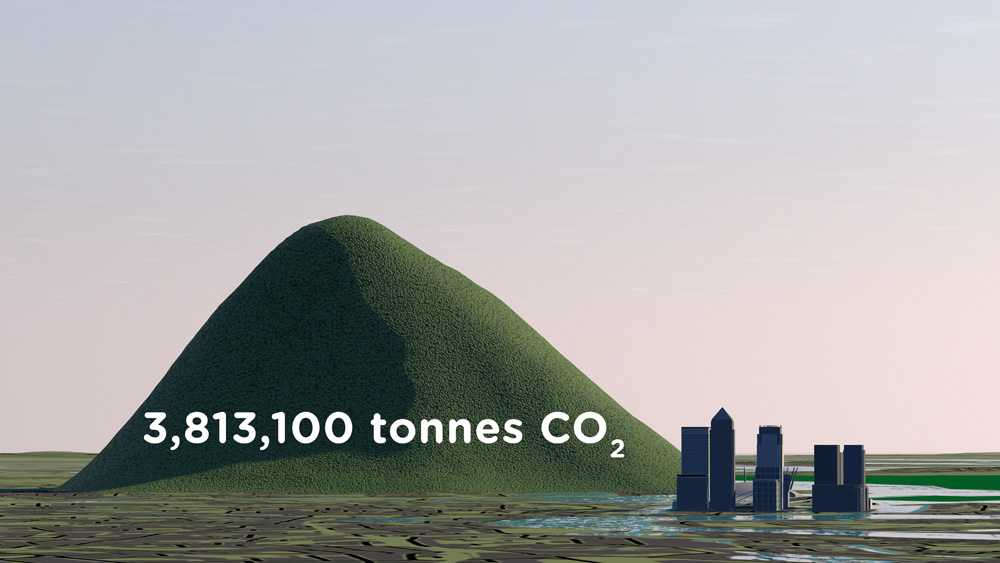
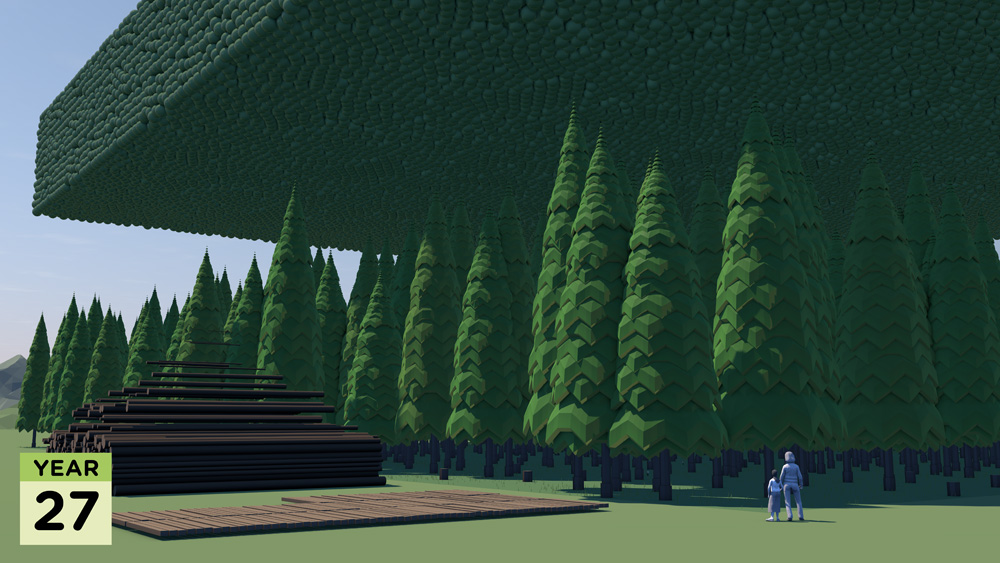
Business

Get Positive

CLIENT

Kingfisher plc

PURPOSE

To encourage staff interest in environmental impacts and corporate goals.

DESCRIPTION

Animation, stills and physical objects using volumes, displays and fun to make emissions and paper use more tangible.

Feedback from the launch has been very positive with people really taking to the visualisation of a tricky issue.

Sinead Conway, Net Positive Delivery Manager, Kingfisher plc

International retail group Kingfisher has developed a forward-looking approach to sustainability with a long-term Net Positive goal. This involves all employees including those based in the corporate centre.

We advised on presenting key data on emissions and paper use in fun, encouraging and engaging ways to spark interest at an internal launch event.

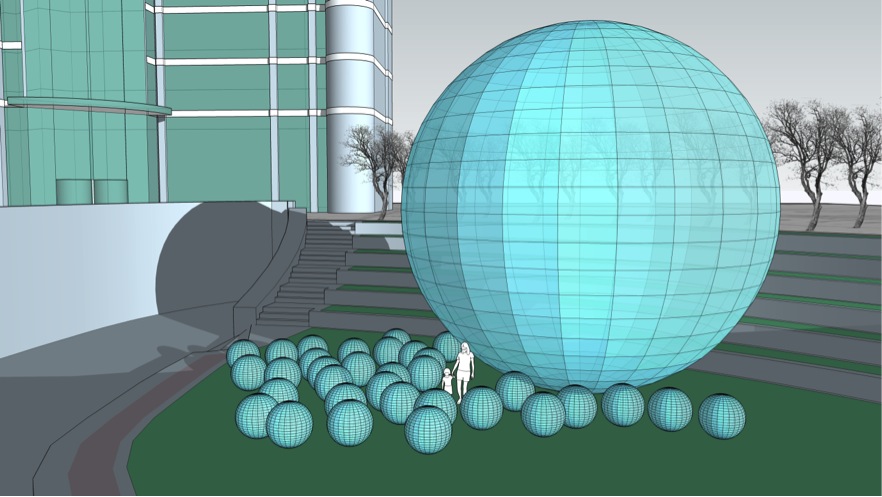
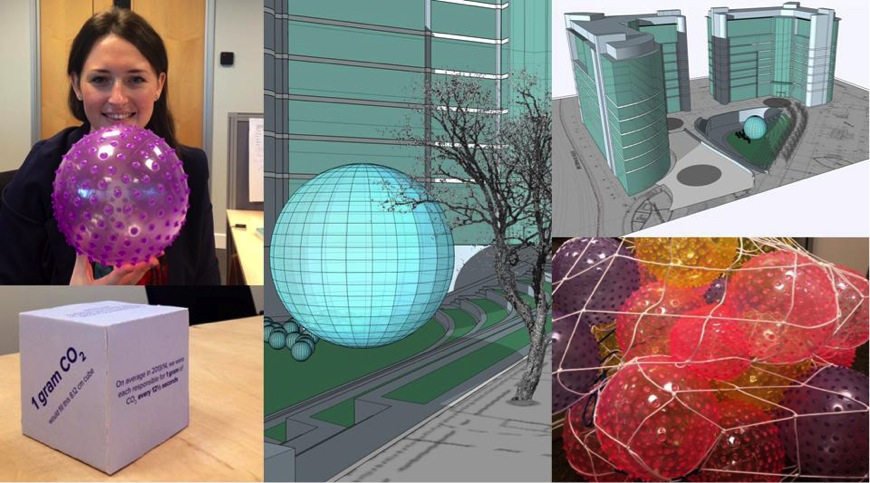
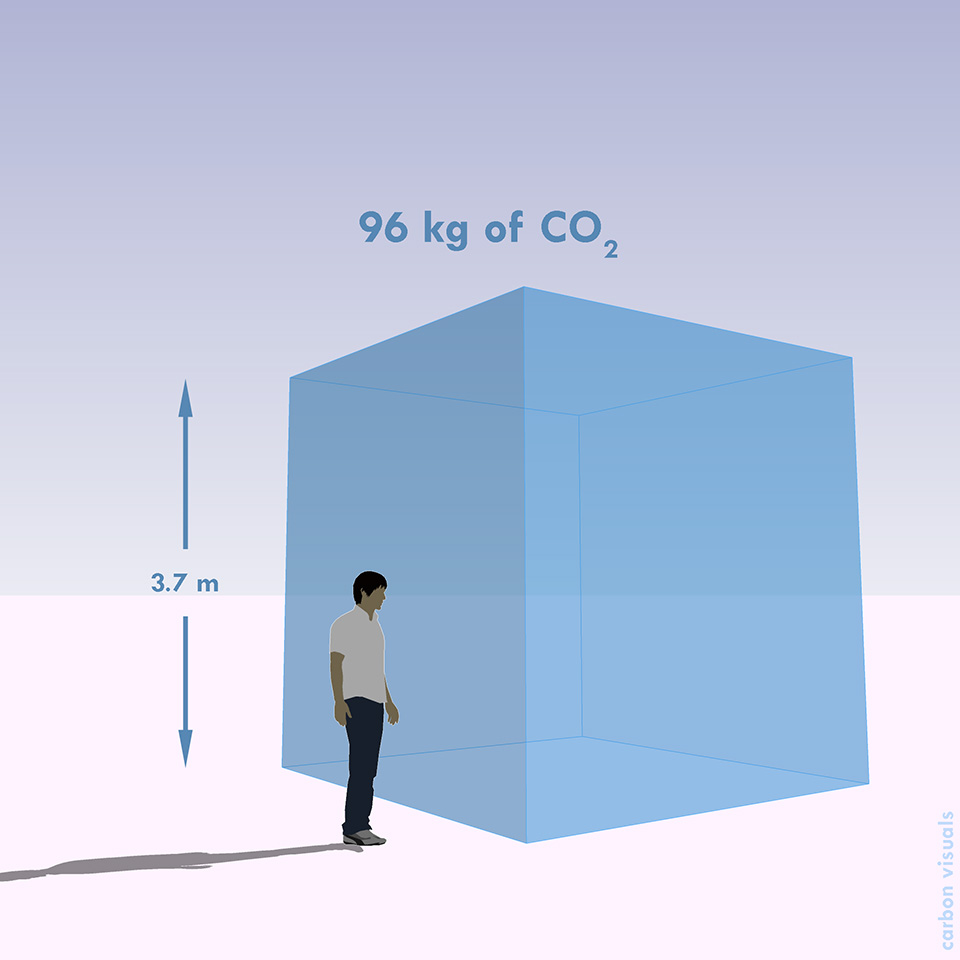
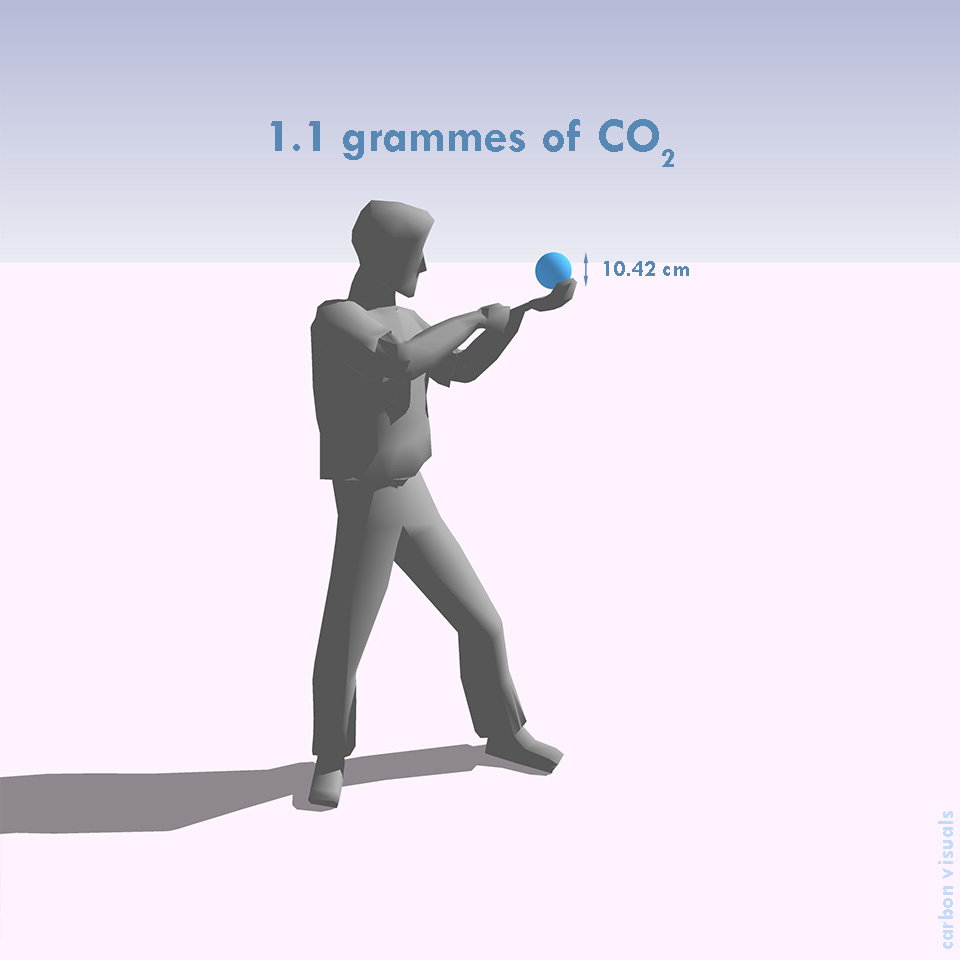
We provided a short volumetric animation set in a scene familiar to staff, and a set of cubes equivalent in size to one gram of carbon dioxide at 15°C and standard pressure. We also supplied one hour’s worth of brightly coloured balls sized to equate to emissions per person per minute and co-designed a striking display of current paper use.

Staff really responded positively to the personal element, seeing data broken down by person and in relation to familiar spaces.

Hannah Judge-Brown, Interim Programme Advisor - Net Positive, Kingfisher plc

How do you sell low carbon?

CLIENT

Self-initiated

PURPOSE

To put visuals of real-time emissions into users hands.

DESCRIPTION

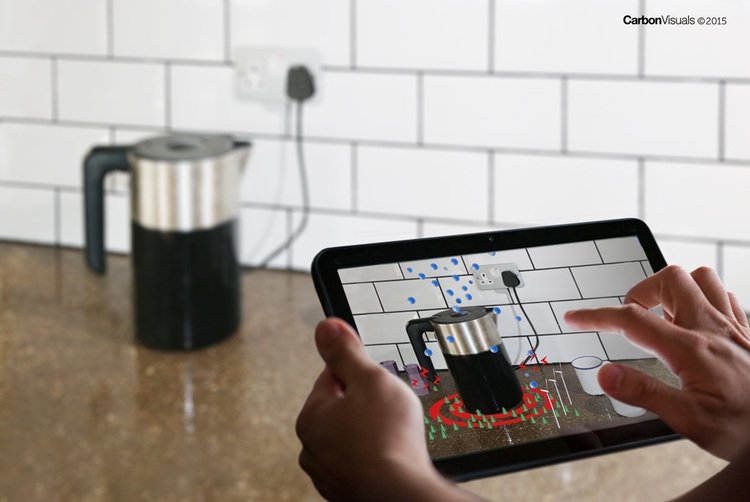
Development of an augmented reality app that reveals actual volumes of CO2 through a smart-phone or tablet screen.

How do you sell low or zero carbon products and services? As more and more companies are putting serious effort into developing products and services for the low-carbon future they face a communications challenge with consumers or B2B customers. How do you get across the benefits of low-carbon in a way that works?

Now there is a solution... an augmented reality app that reveals actual volumes of CO2 through a smart-phone or tablet screen.

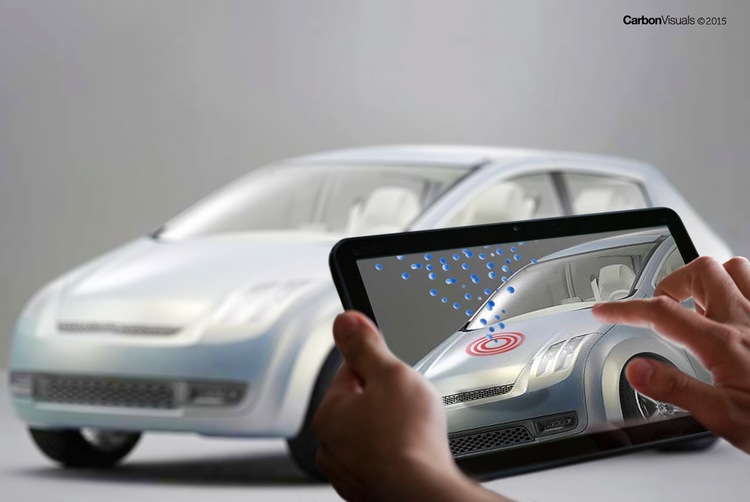
We are pleased to announce that we are developing an app which allows viewers to ‘see’ the volumetrically accurate carbon emissions associated with household appliances, furnishings, vehicles, buildings, power stations... as real-time flows or bubble piles. Furthermore, using the app, sales teams and their potential customers will be able to compare services and products clearly showing the difference in emissions in the purchase of low-carbon options.

The ability to reach out to consumers through simple apps is very compelling.

Antony Turner, CEO Carbon Visuals

The ability to reach out to consumers through simple apps is very compelling. In addition we can design a complete sales solution around the app that engages and easily invites B2B or B2C customers to purchase low-carbon options.

Key features of the app include:

COMPARISON - shows the carbon footprint of products or services in comparison to your competitors

ACTUAL VOLUMES - demonstrates the actual volumes of CO2 as real-time streams or bubble piles / blocks

SHOW COSTS – combines with other important metrics e.g. costs

EASY-TO-USE - we work with your marketing team to create relevant and easy user interface within your sales campaigns

Versions are envisaged that highlight and compare low-carbon benefits of energy, vehicles, furnishings, building products etc.

For instance we can design a system for the green energy market where consumers are invited to buy energy that has a substantially lower carbon footprint than a fossil-fuel based energy mix. We envisage combining the technology with an elegant sales promotion campaign developed with the energy company's own marketing team.

Another example envisaged would be a version for use in car dealerships where new plug-in or eco-efficient cars are for sale. A simple set of questions about a customer’s existing car and journeys can allow the sales rep to immediately show the emissions associated with the 'old' car v the new model alongside financial savings.

Educational opportunities are limitless provided the data is available, and games-based versions could enable understanding of our 'high-carbon' world in a fun and sharable way.

To find out more about how this app could help your sales campaign, or to discuss other potential applications, please contact:

Antony Turner, CEO antony.turner@carbonvisuals.com

Visualising water use for AGM

CLIENT

South West Water

PURPOSE


Film to provide shareholders with an engaging view of the business, highlight the challenge of managing a finite resource, and demonstrate the company's competence.

DESCRIPTION

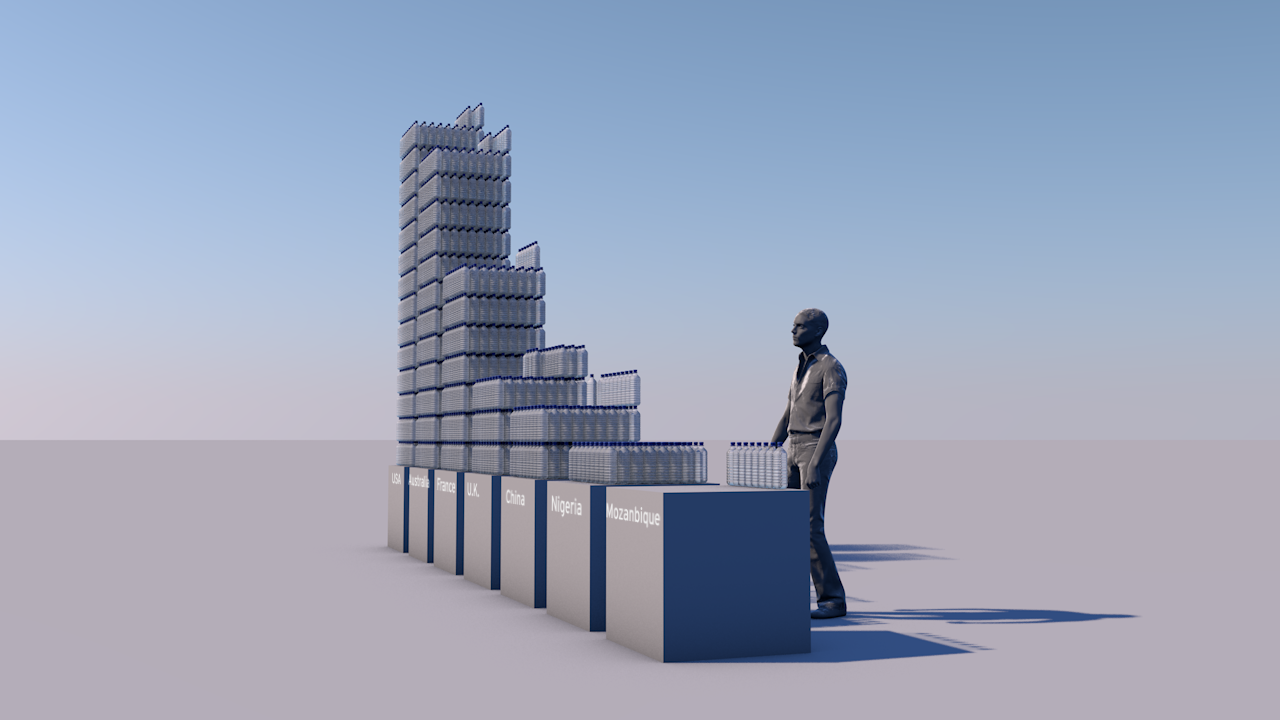
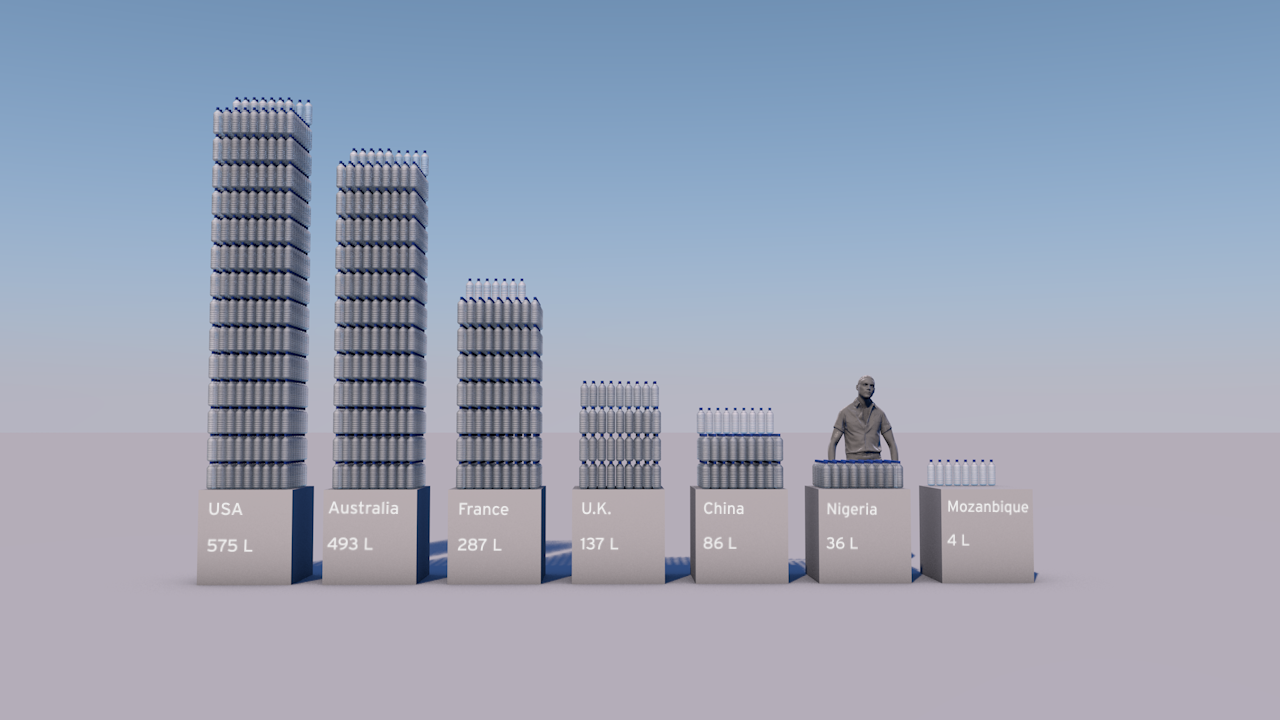
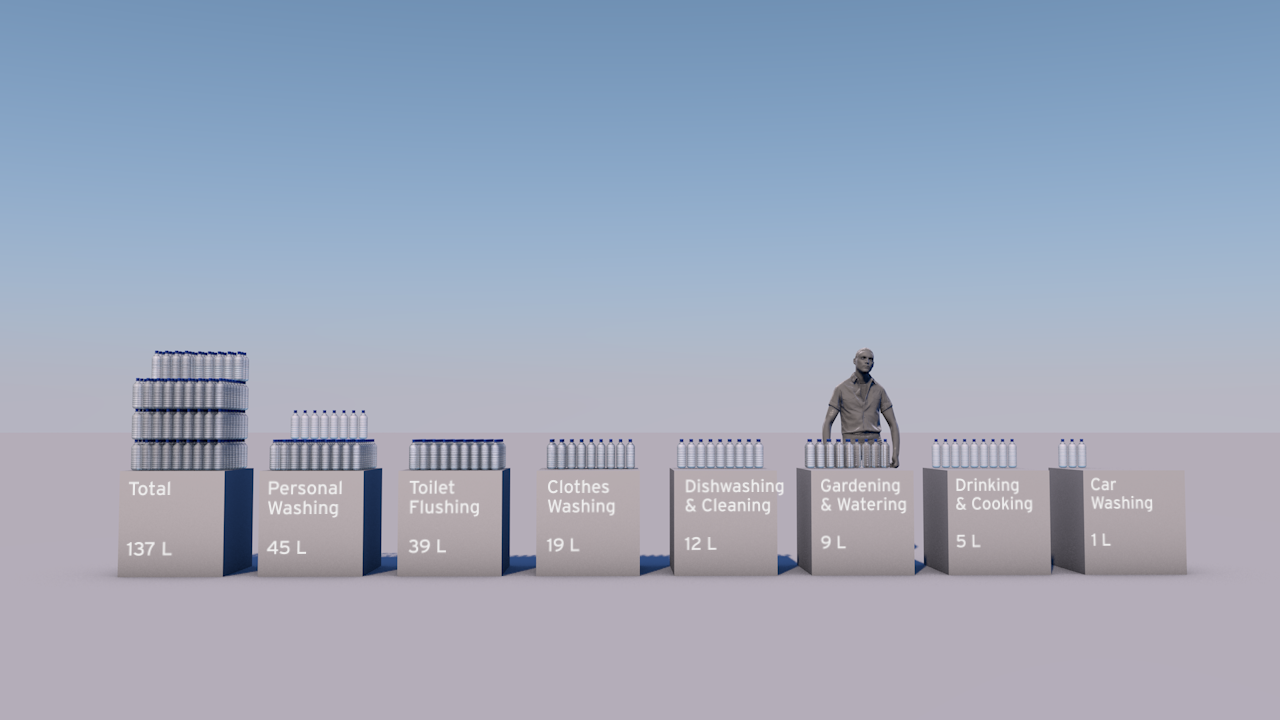
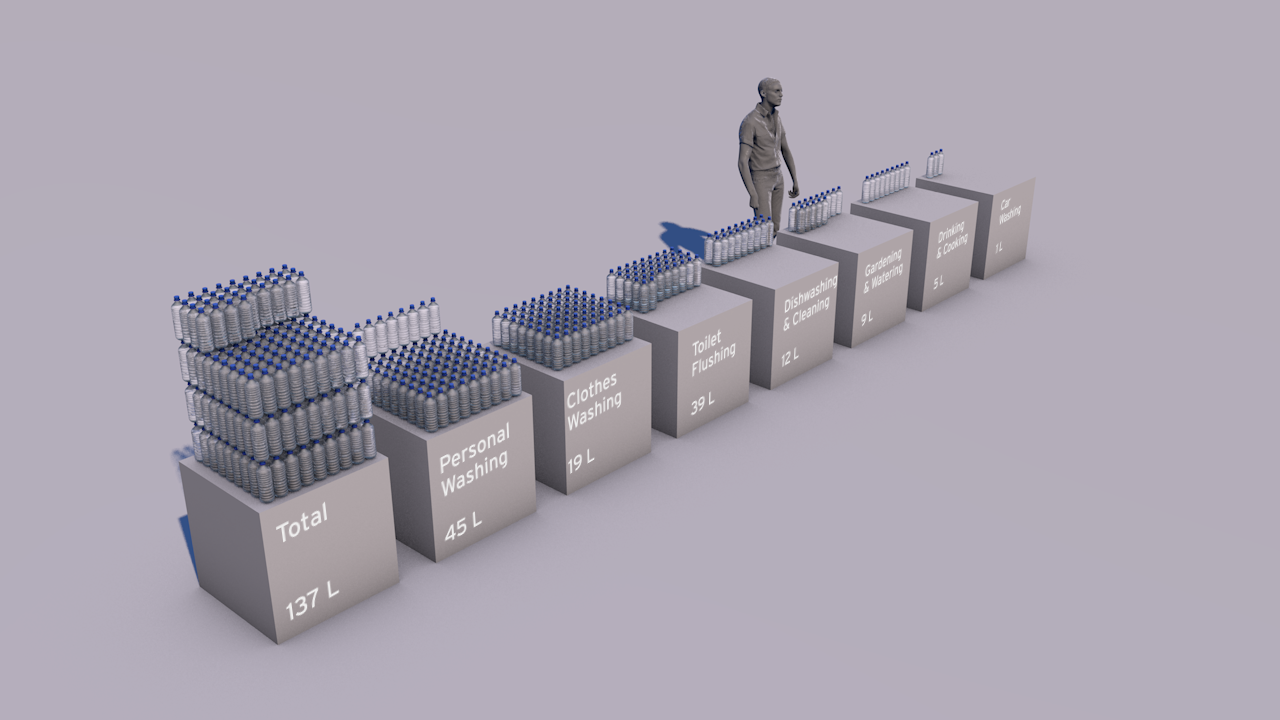
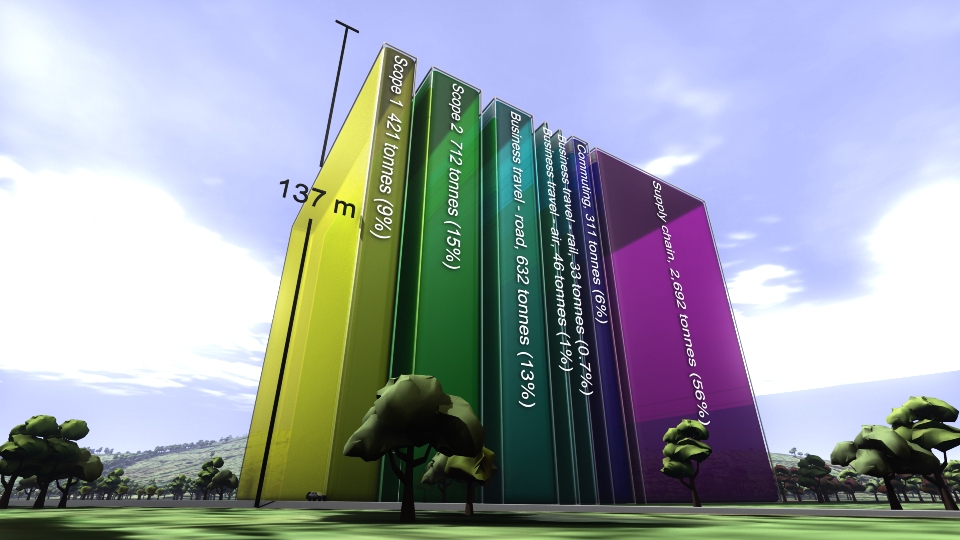
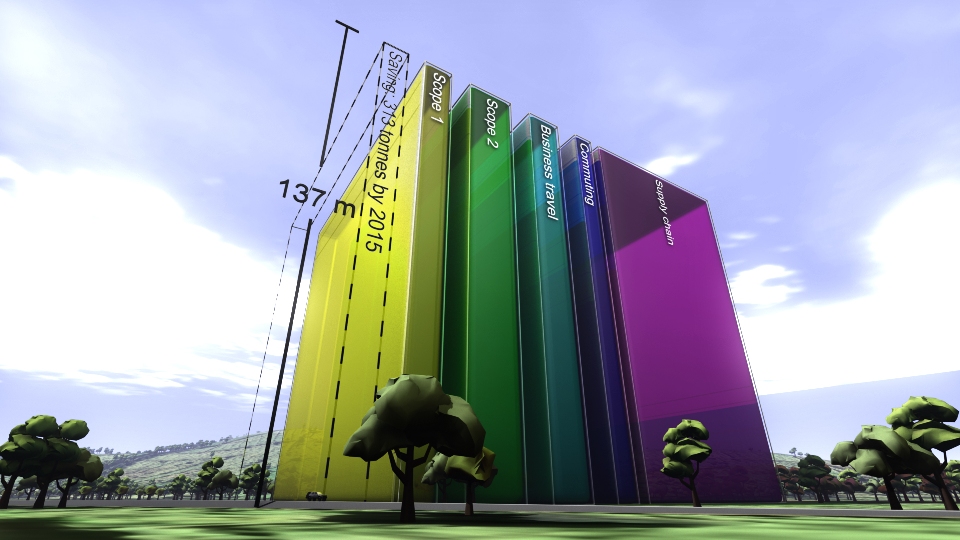
Animation showing the volume of the world's drinking water and real-time water use by the business. Also, images showing UK water use per head, comparison with other countries and the breakdown of how 137 litres per person is used.

South West Water, a utility business supplying drinking water and waste water services in the south west of England, wanted a short film for the 2014 Annual General Meeting (AGM) of their parent company Pennon Group Plc.

The aim was to provide shareholders who attended the meeting with a different and engaging view of the business, highlighting the challenge of managing a finite resource, and demonstrating the company's competence.

We created a short animation showing the volume of the world's drinking water, and a view of the actual water use of the business in real-time. In addition we created several still images showing UK water use per head compared to other countries, and the breakdown of how the 137 litres per person is used.

Finally we incorporated some video footage from the Space Station as well as some of the client's own photos into the film as a backdrop for key messages.

See Creative Director Adam Nieman's blog on visualising water here.

The case for Carbon Capture & Storage

CLIENT

World Business Council for Sustainable Development

PURPOSE

To engage world leaders, industry experts, campaigners and scientists at the UN Climate Summit, New York, September 2014 and to catalyse and inform conversations about reducing carbon emissions.

DESCRIPTION

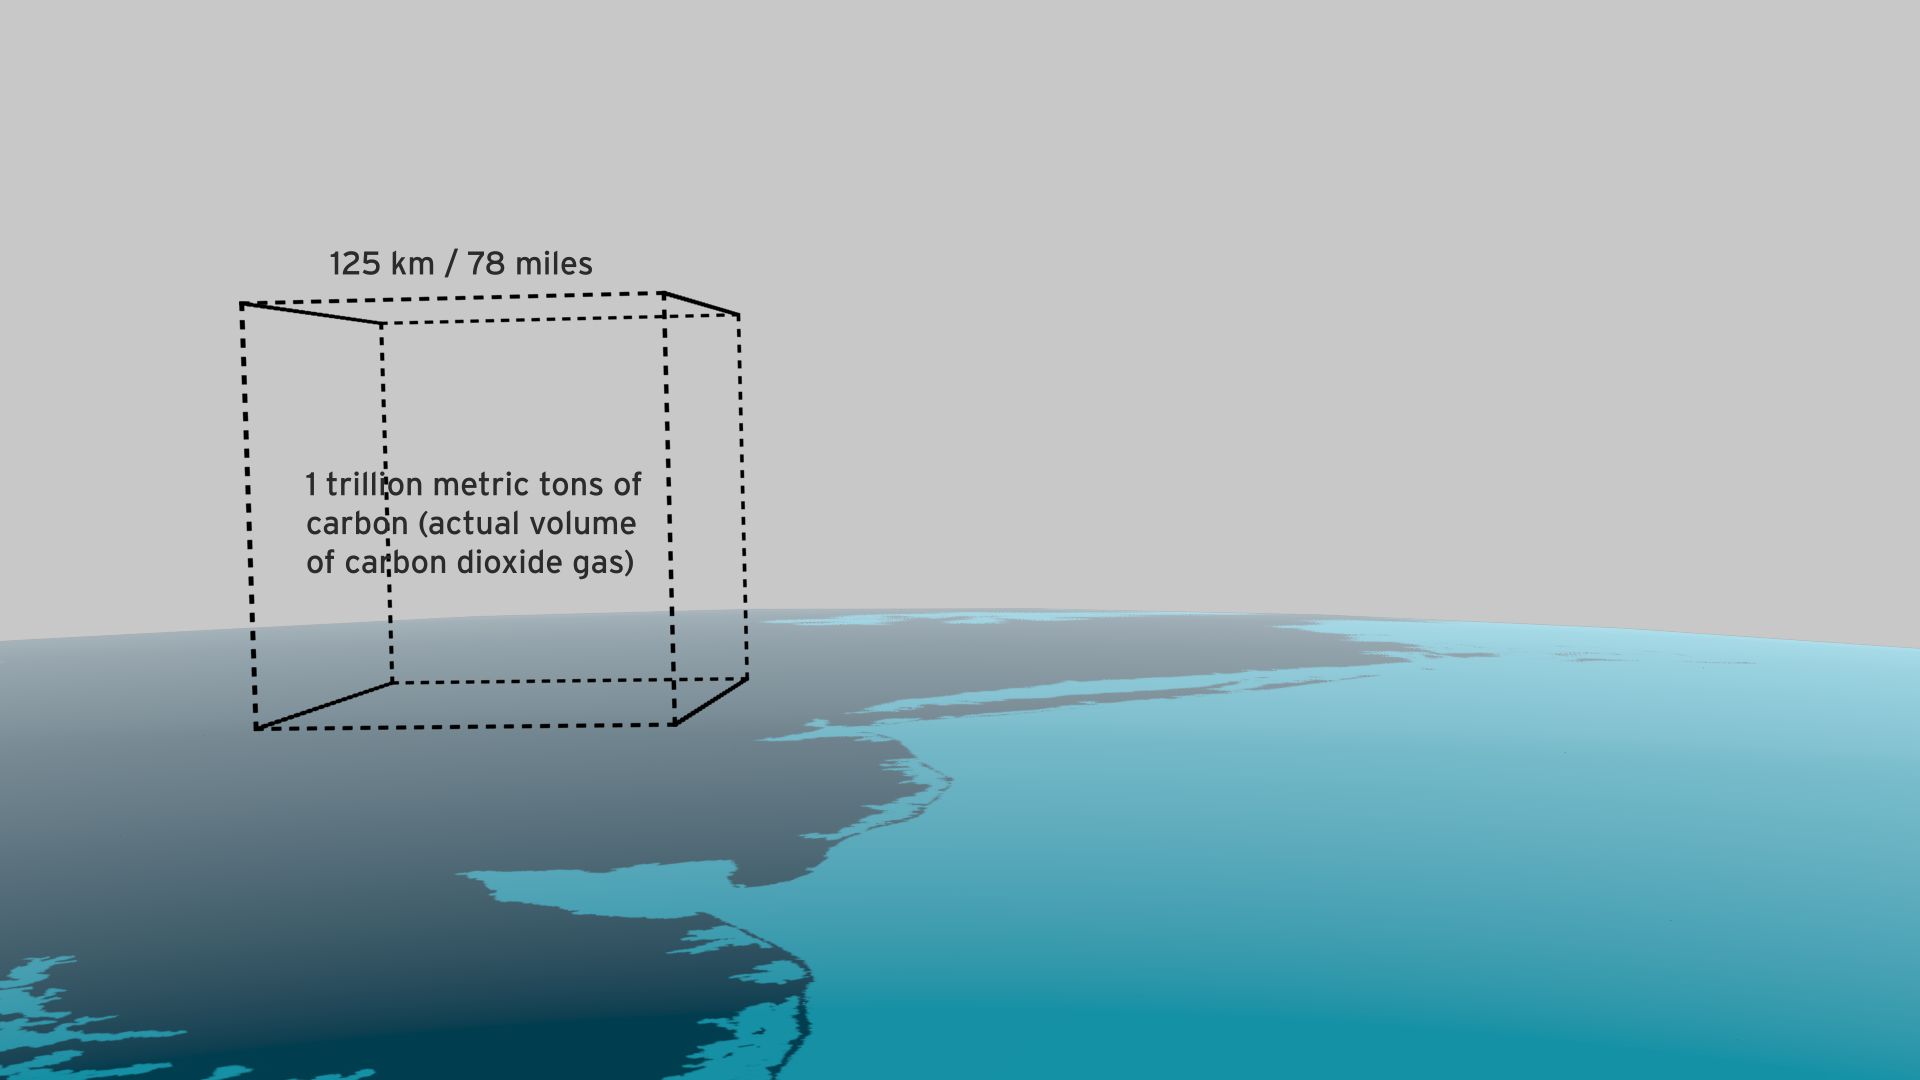
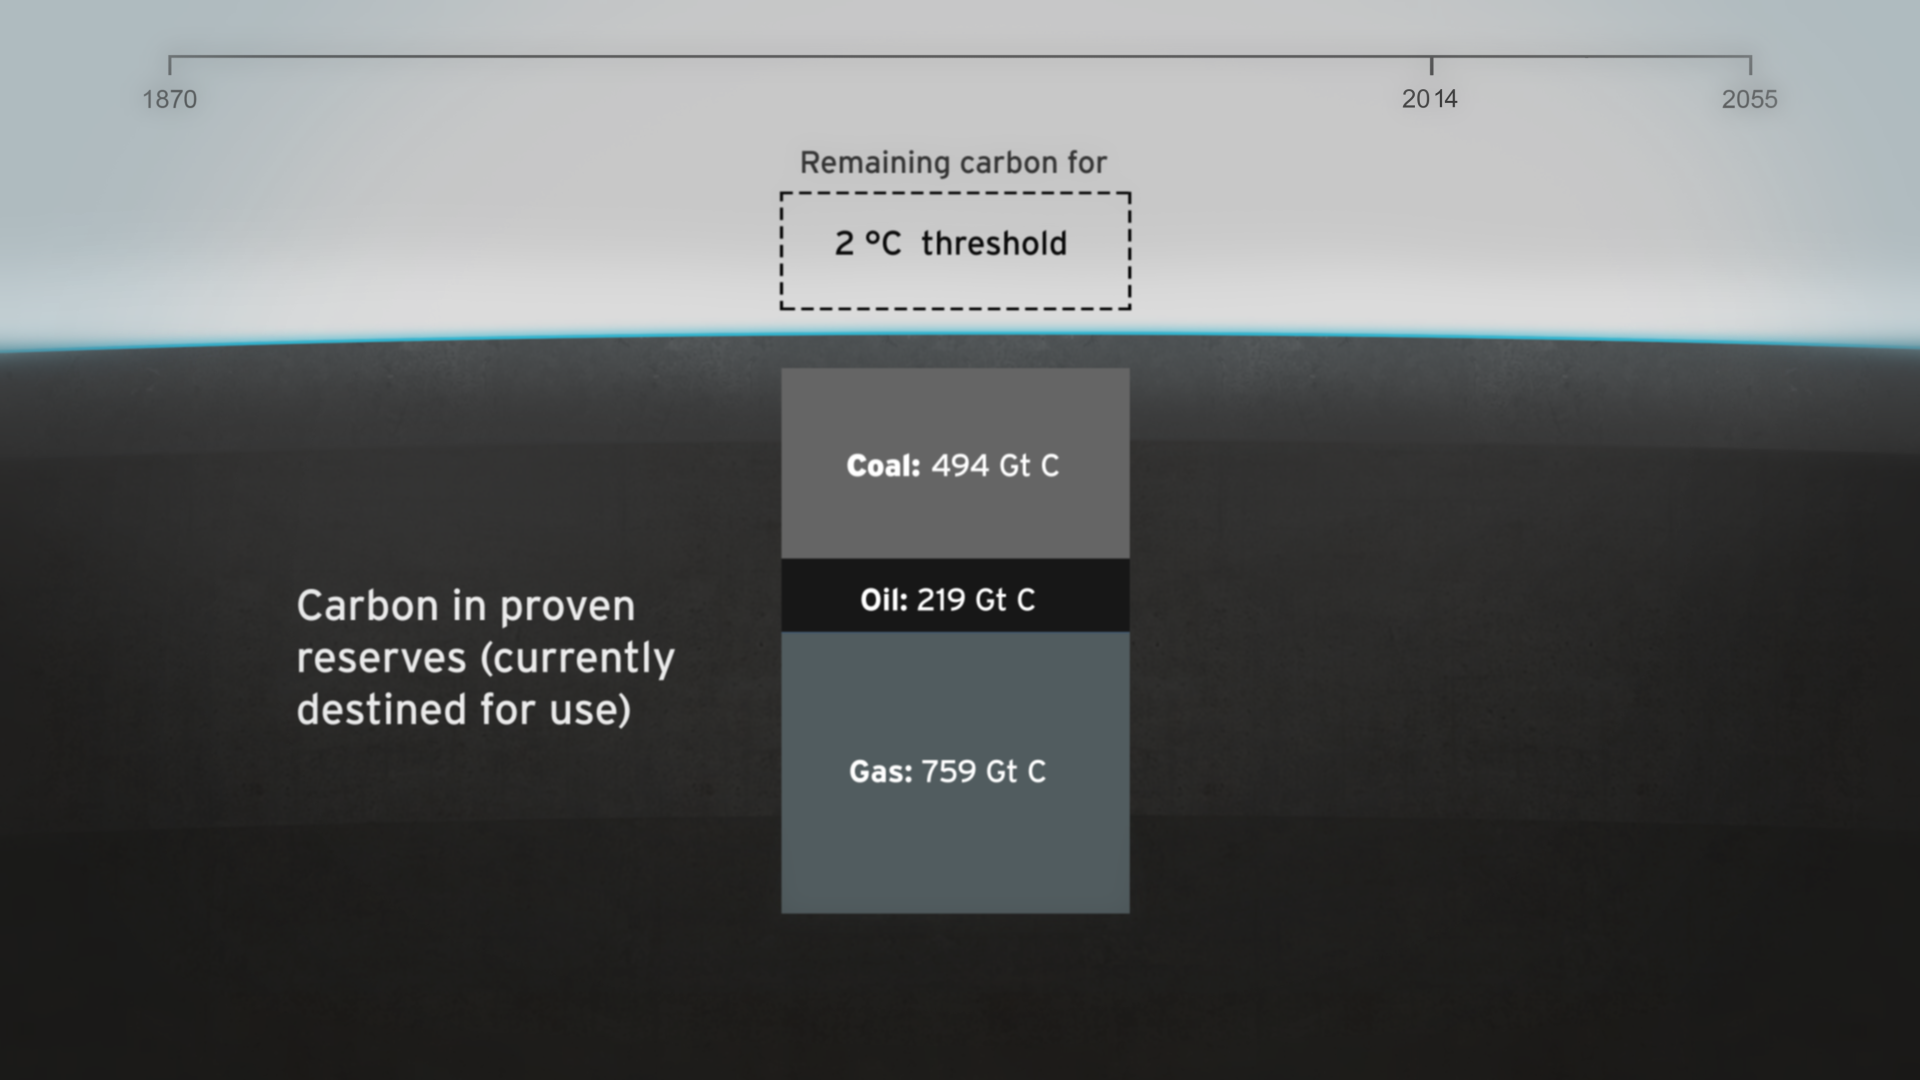
Film showing actual quantities of global fossil fuel consumption and carbon emissions, and the part that carbon capture and storage can play in limiting global climate change to 2 degrees.

Among all of the documents, reports and images being released around the UN summit, we hope that this film will stand out and benefit all participants, as well as anyone who watches it around the world.

Peter Bakker President, WBCSD

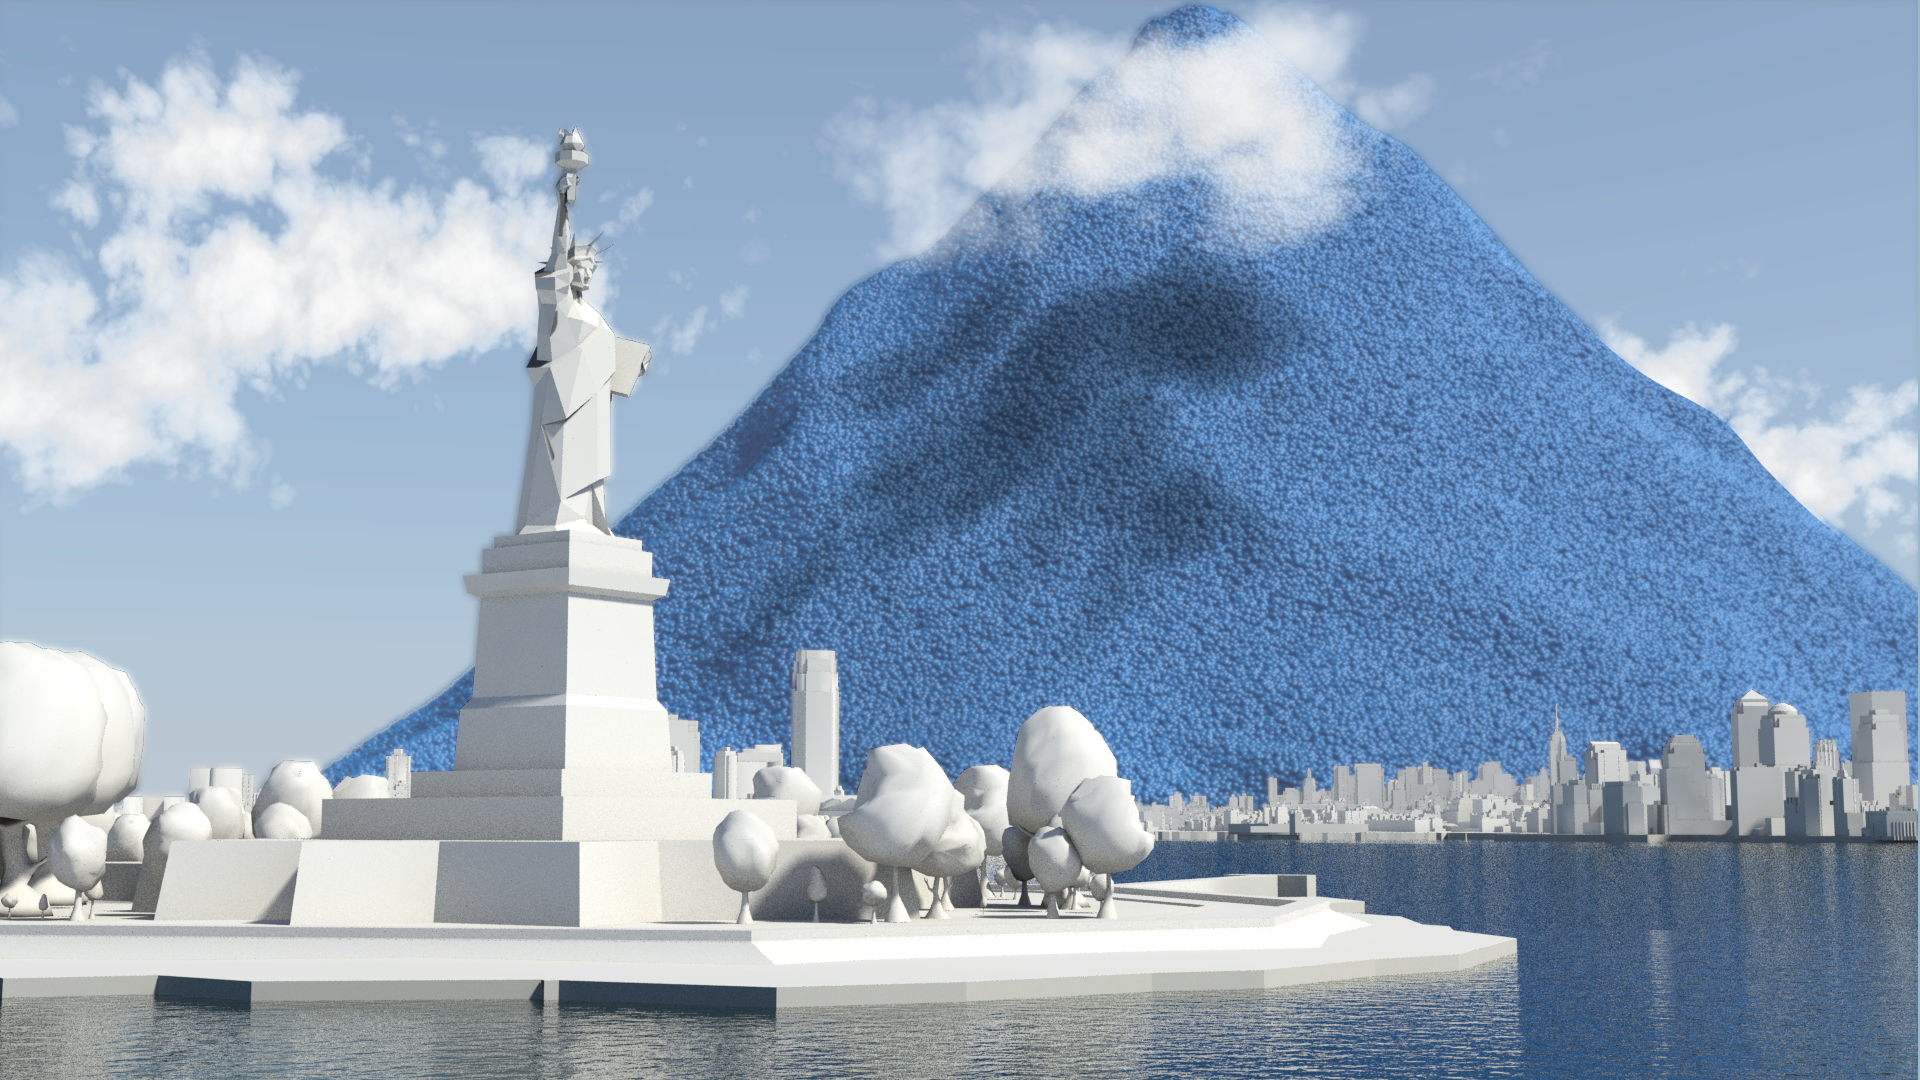
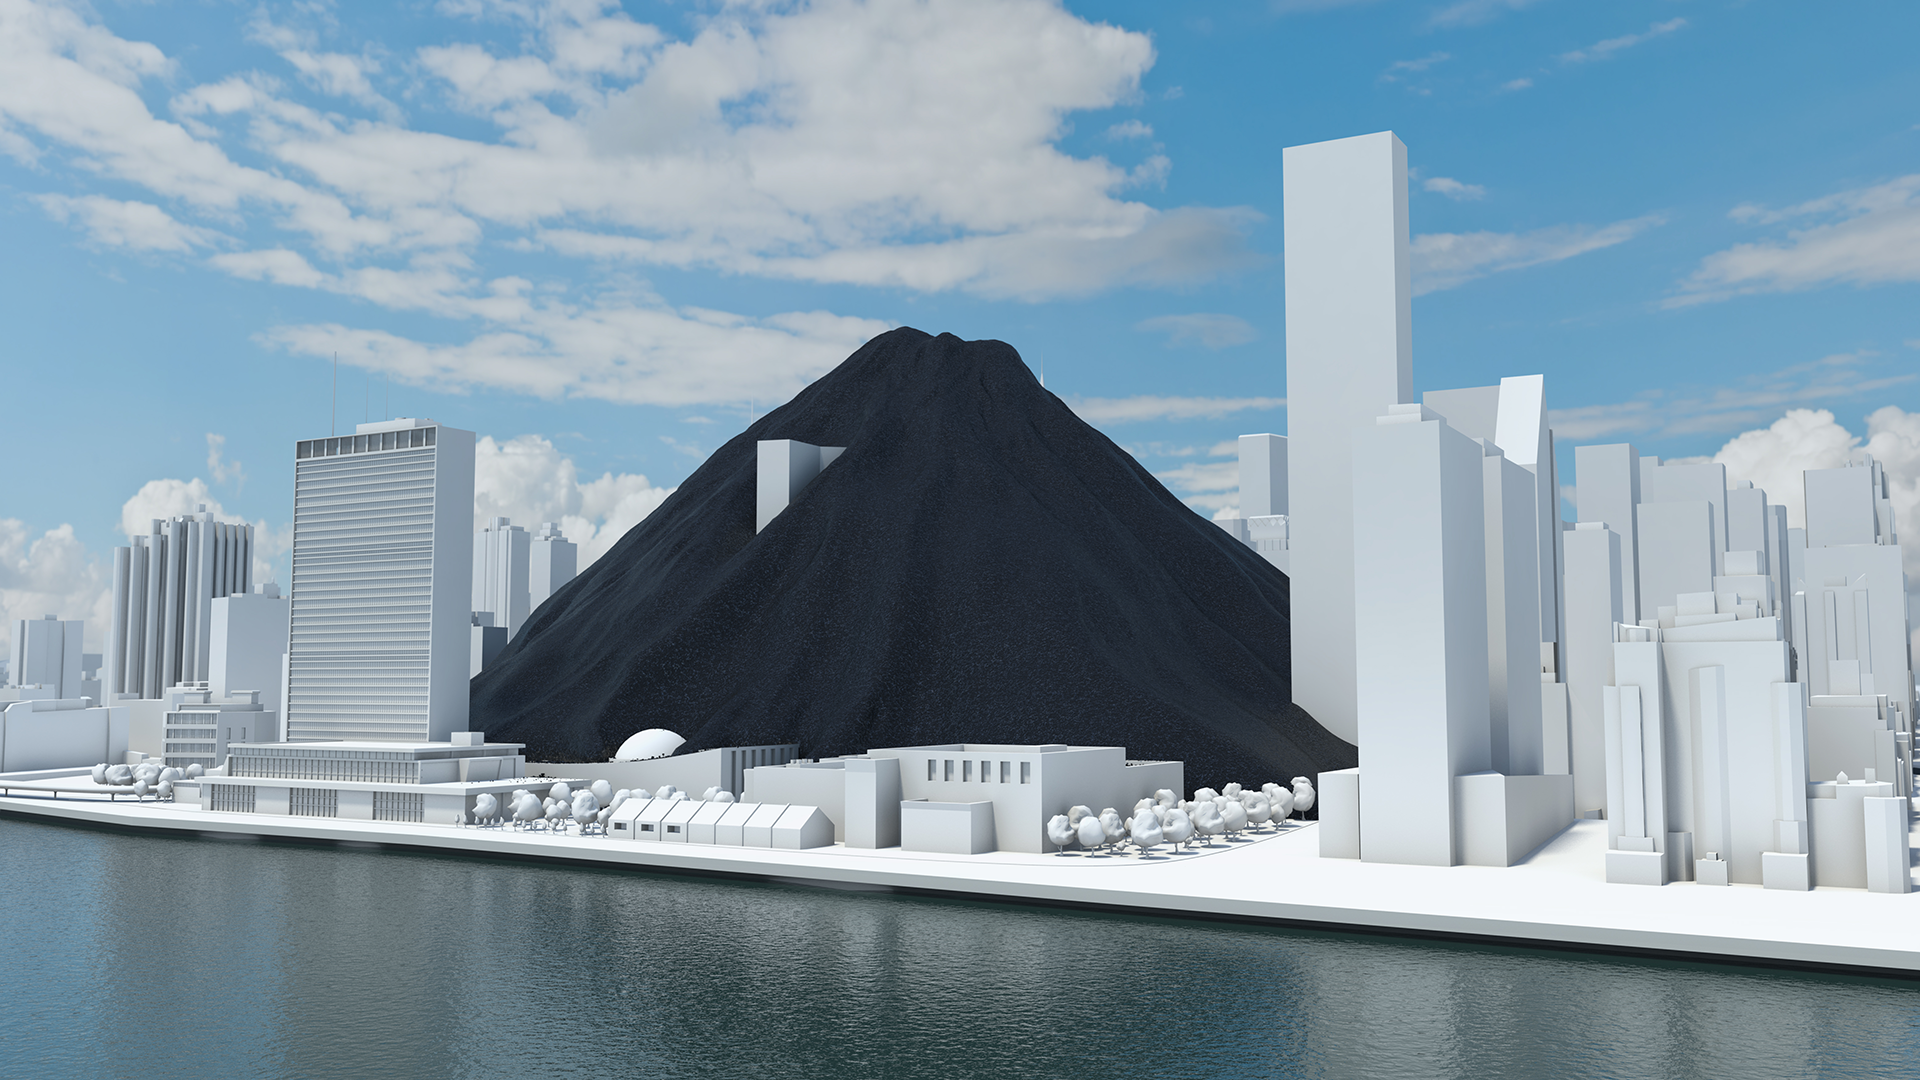
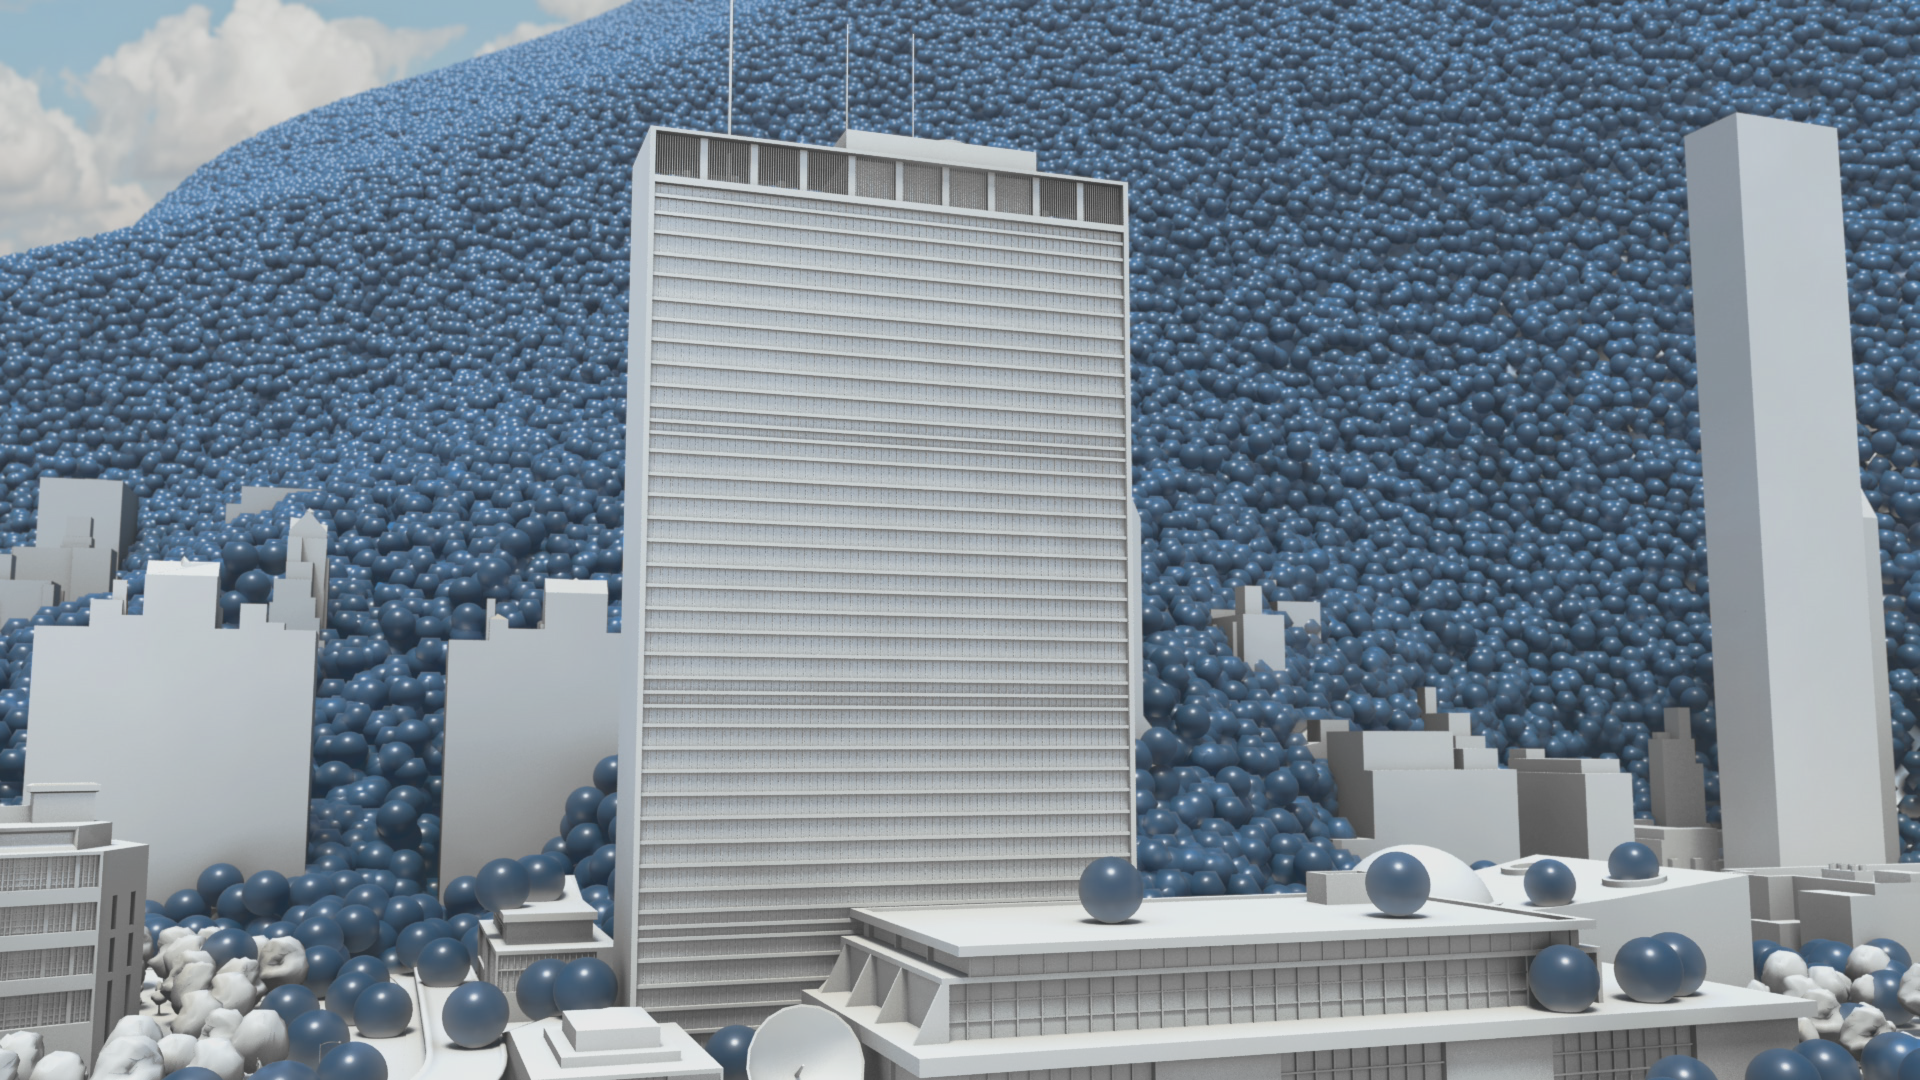
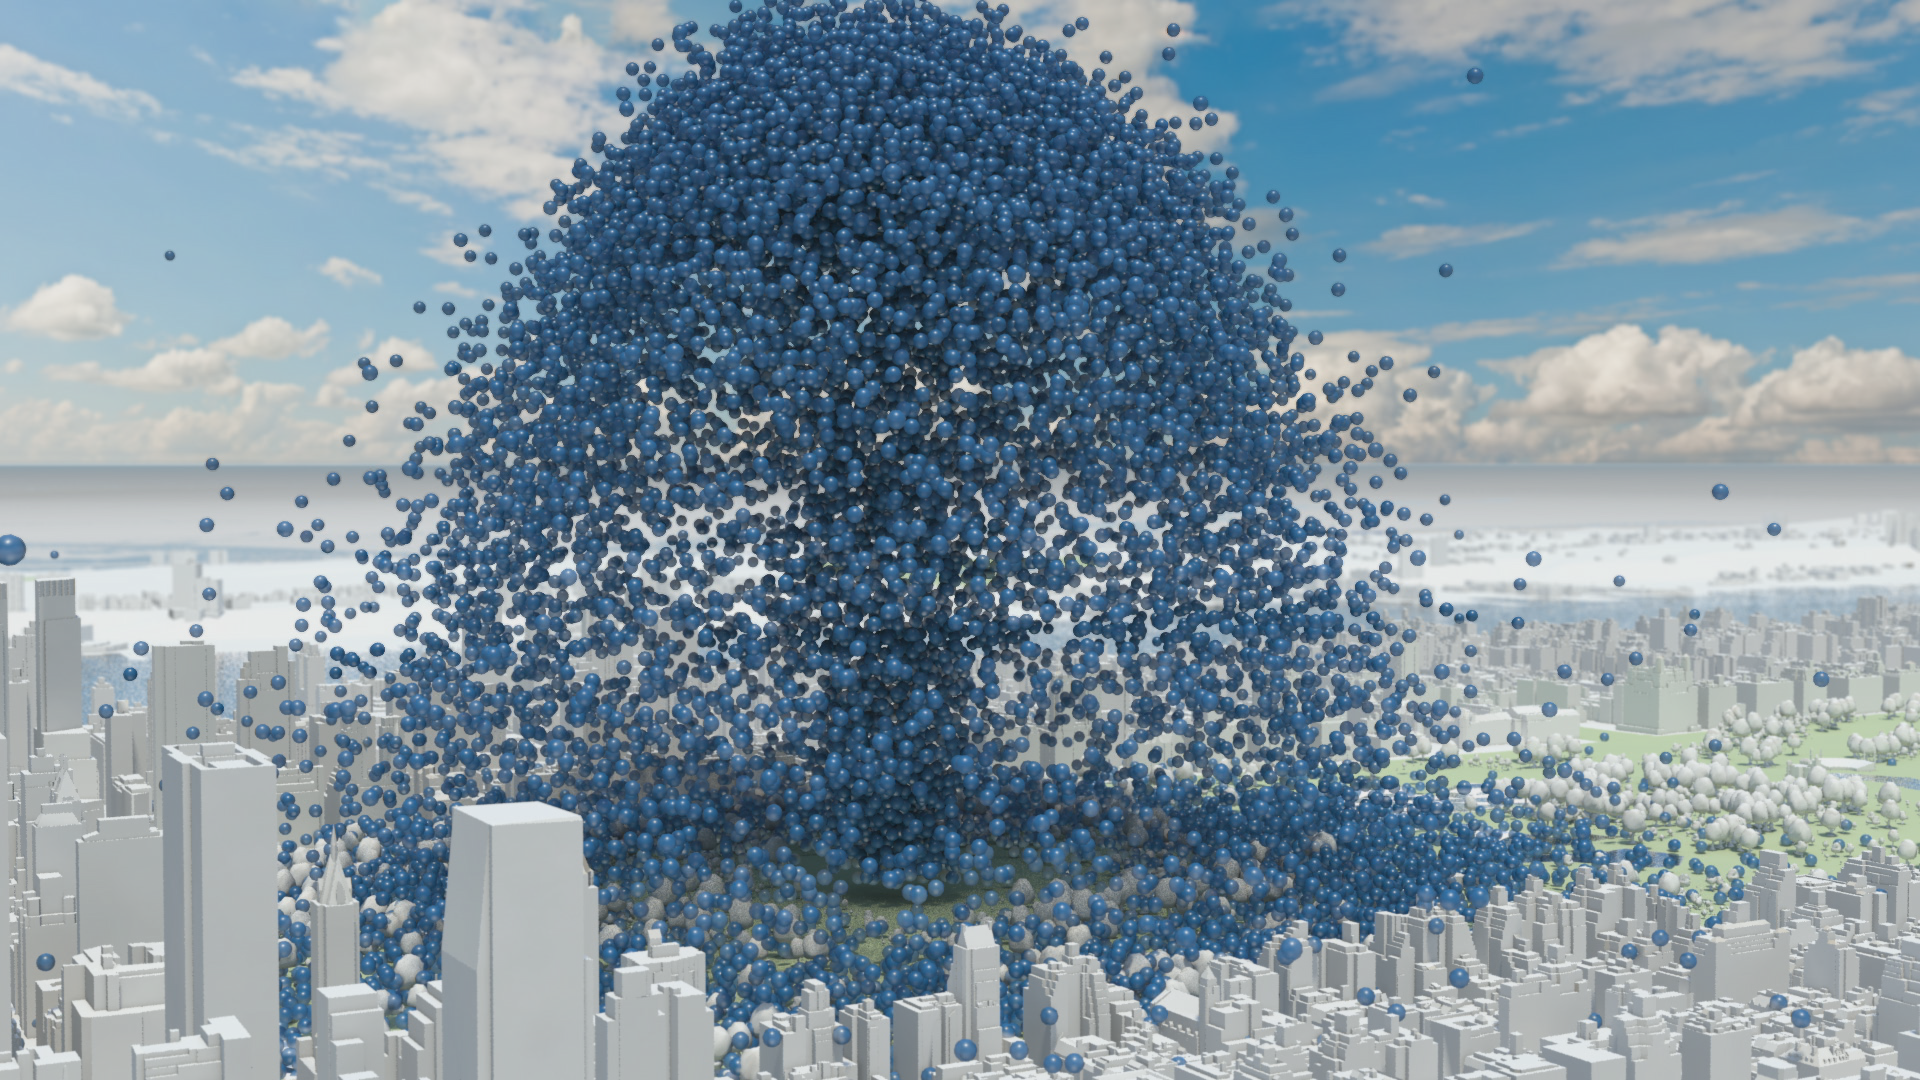
A coal pile buries the UN General Assembly, gas races down 42nd Street and then New York is lost under a blue mountain. These dramatic CGI scenes, depicting actual quantities, create an immersive journey that brings home the scale of global carbon emissions and fossil fuel consumption.

This dynamic four-minute film, being launched at the UN Climate Change Summit in New York September 2014, shows the part that carbon capture and storage can play in limiting global climate change to 2 degrees.

Commissioned by WBCSD and produced by Carbon Visuals, the animation is being shown to world leaders, industry experts, campaigners and scientists at the Summit to help catalyse and inform conversations about reducing carbon emissions.


Key messages of the film:

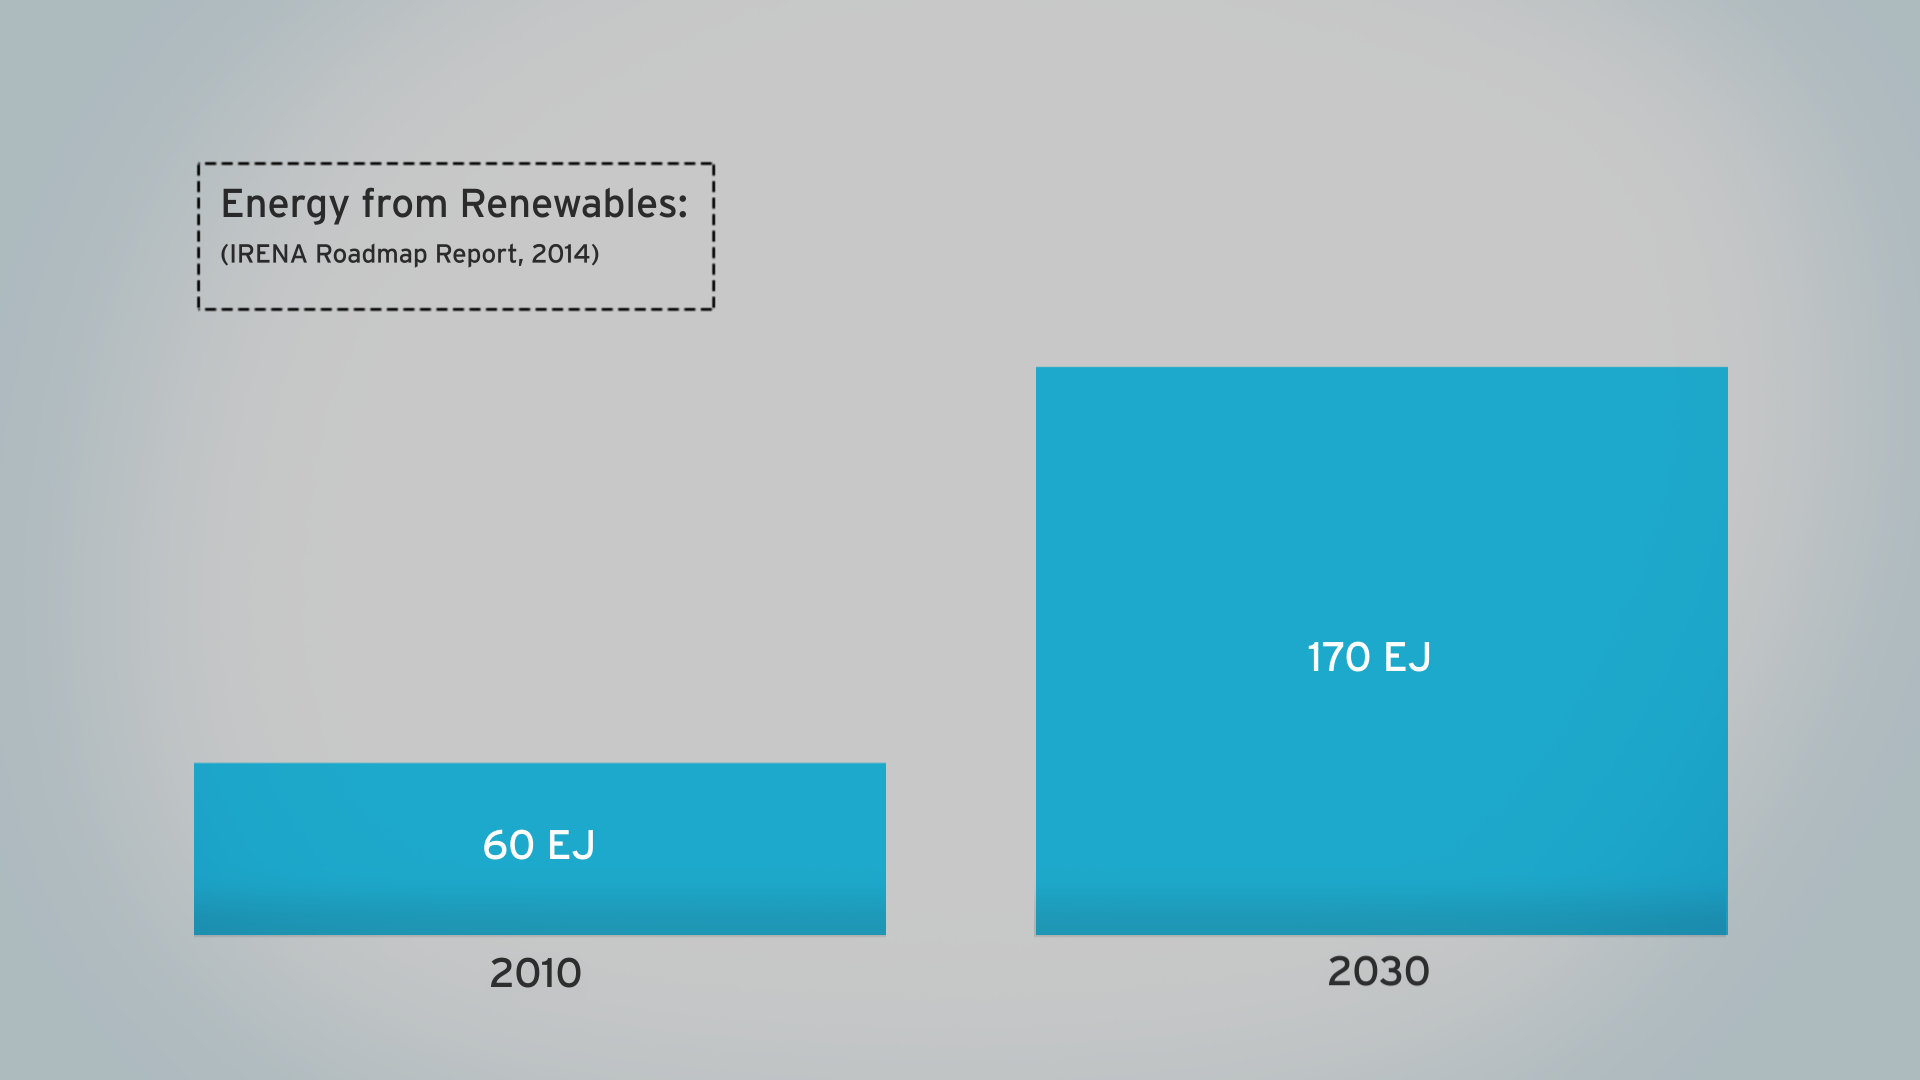
  • use of renewables is increasing
  • but energy use is rising faster
  • fossil fuel use is increasing not decreasing
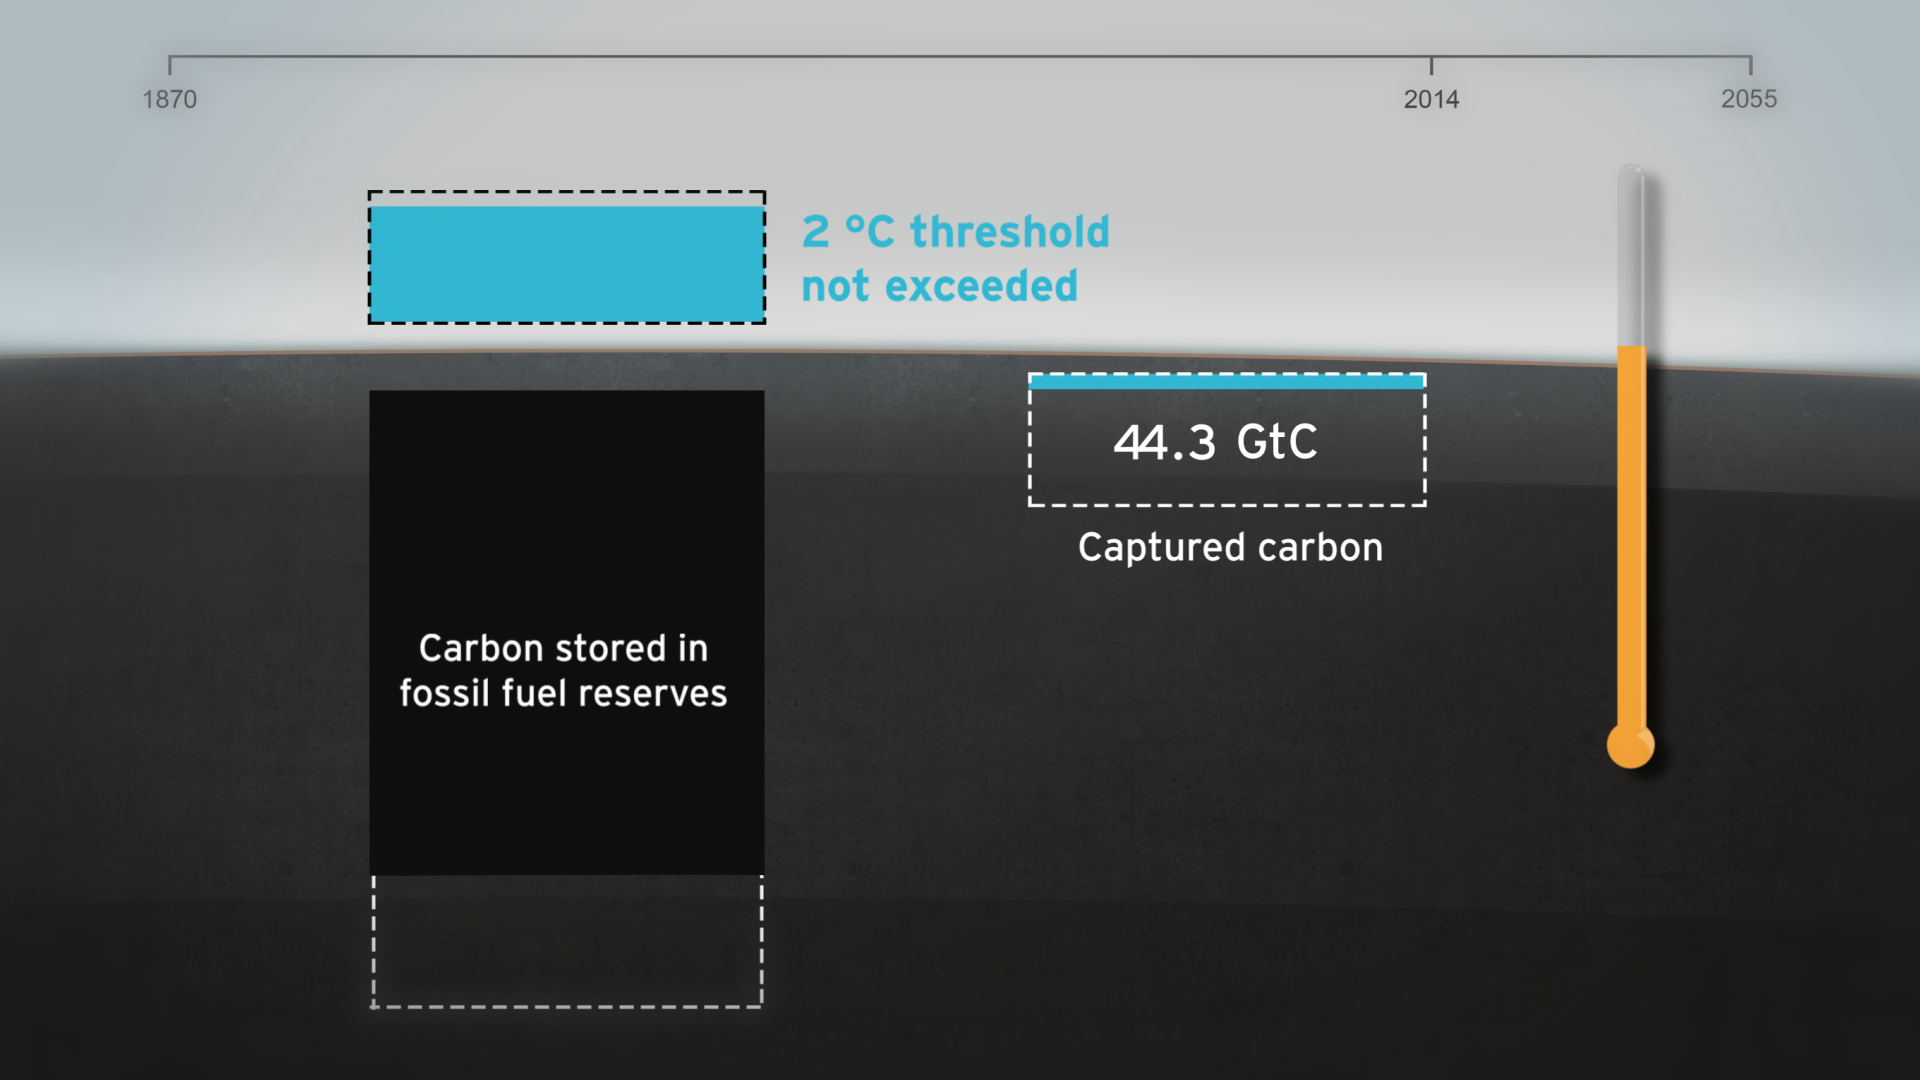
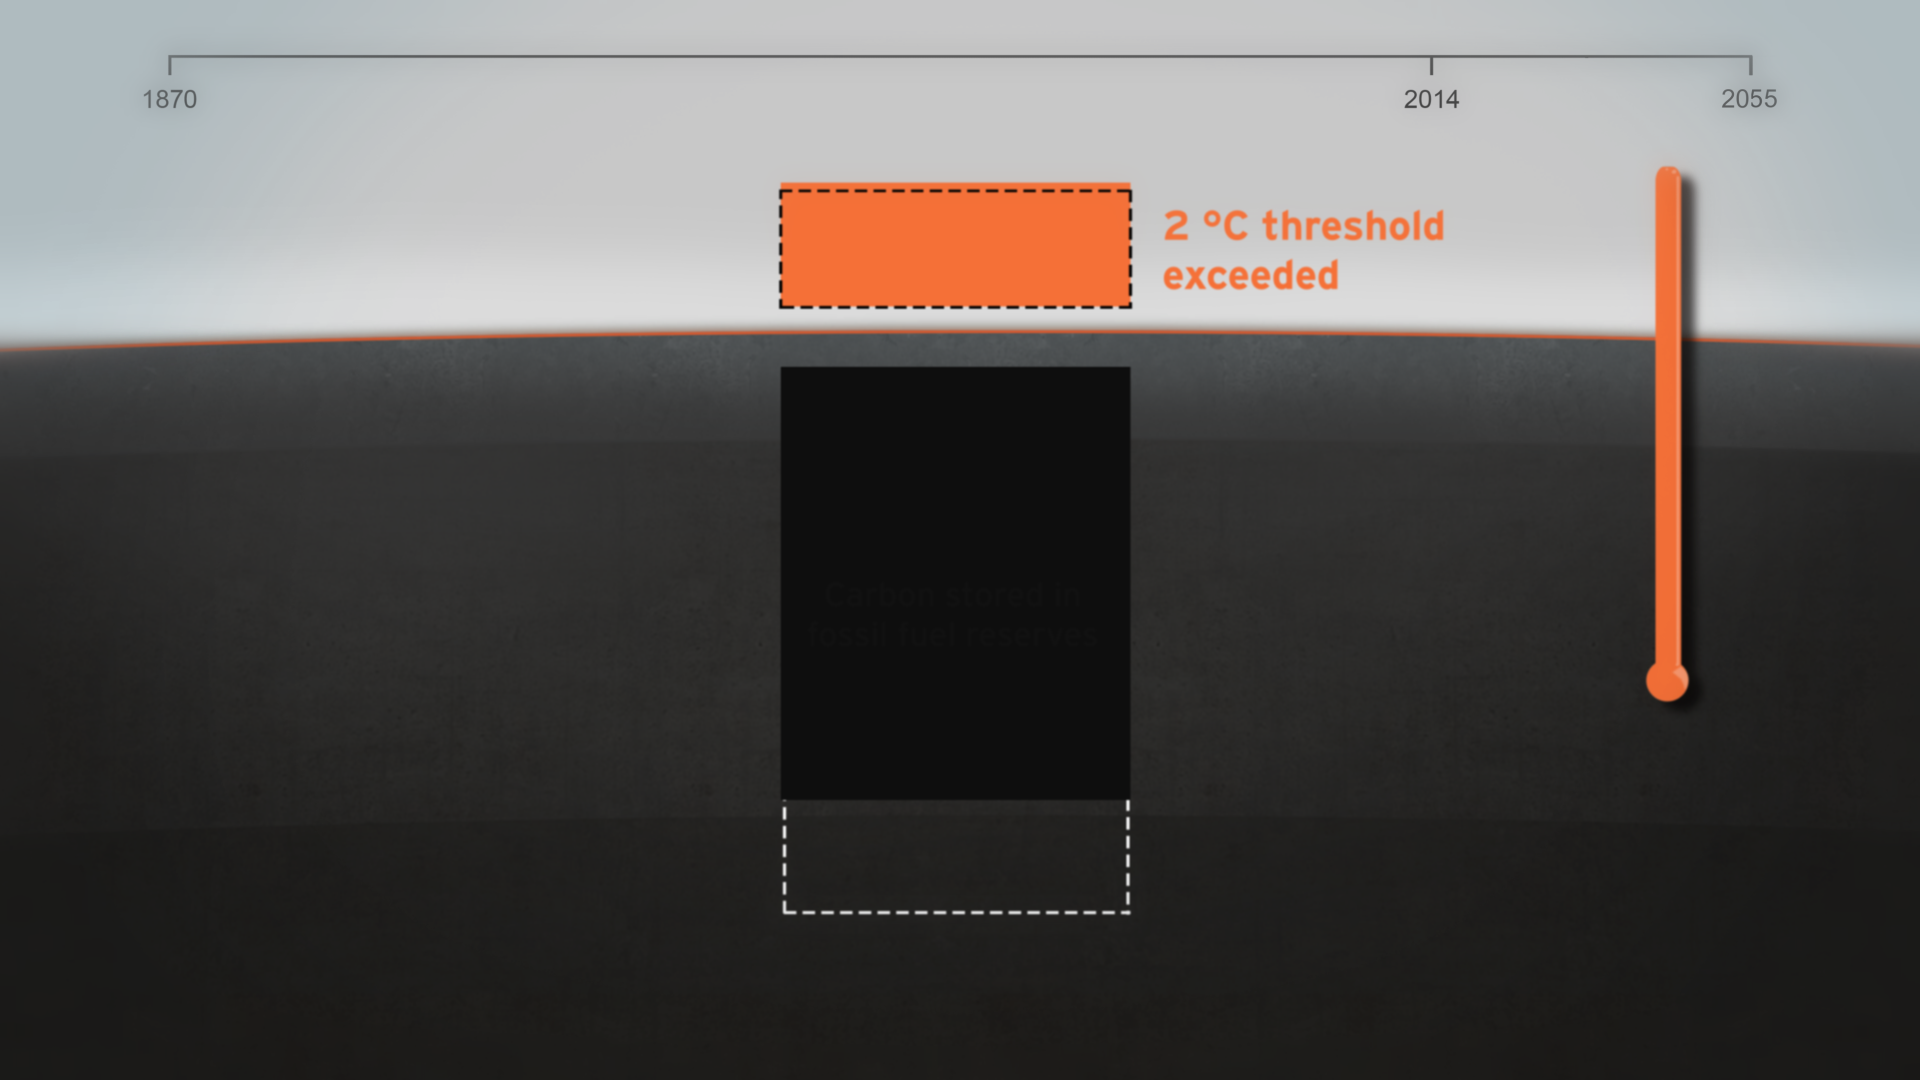
  • if carbon stored in fossil fuel reserves is burnt we exceed 2 degrees warming by 2055
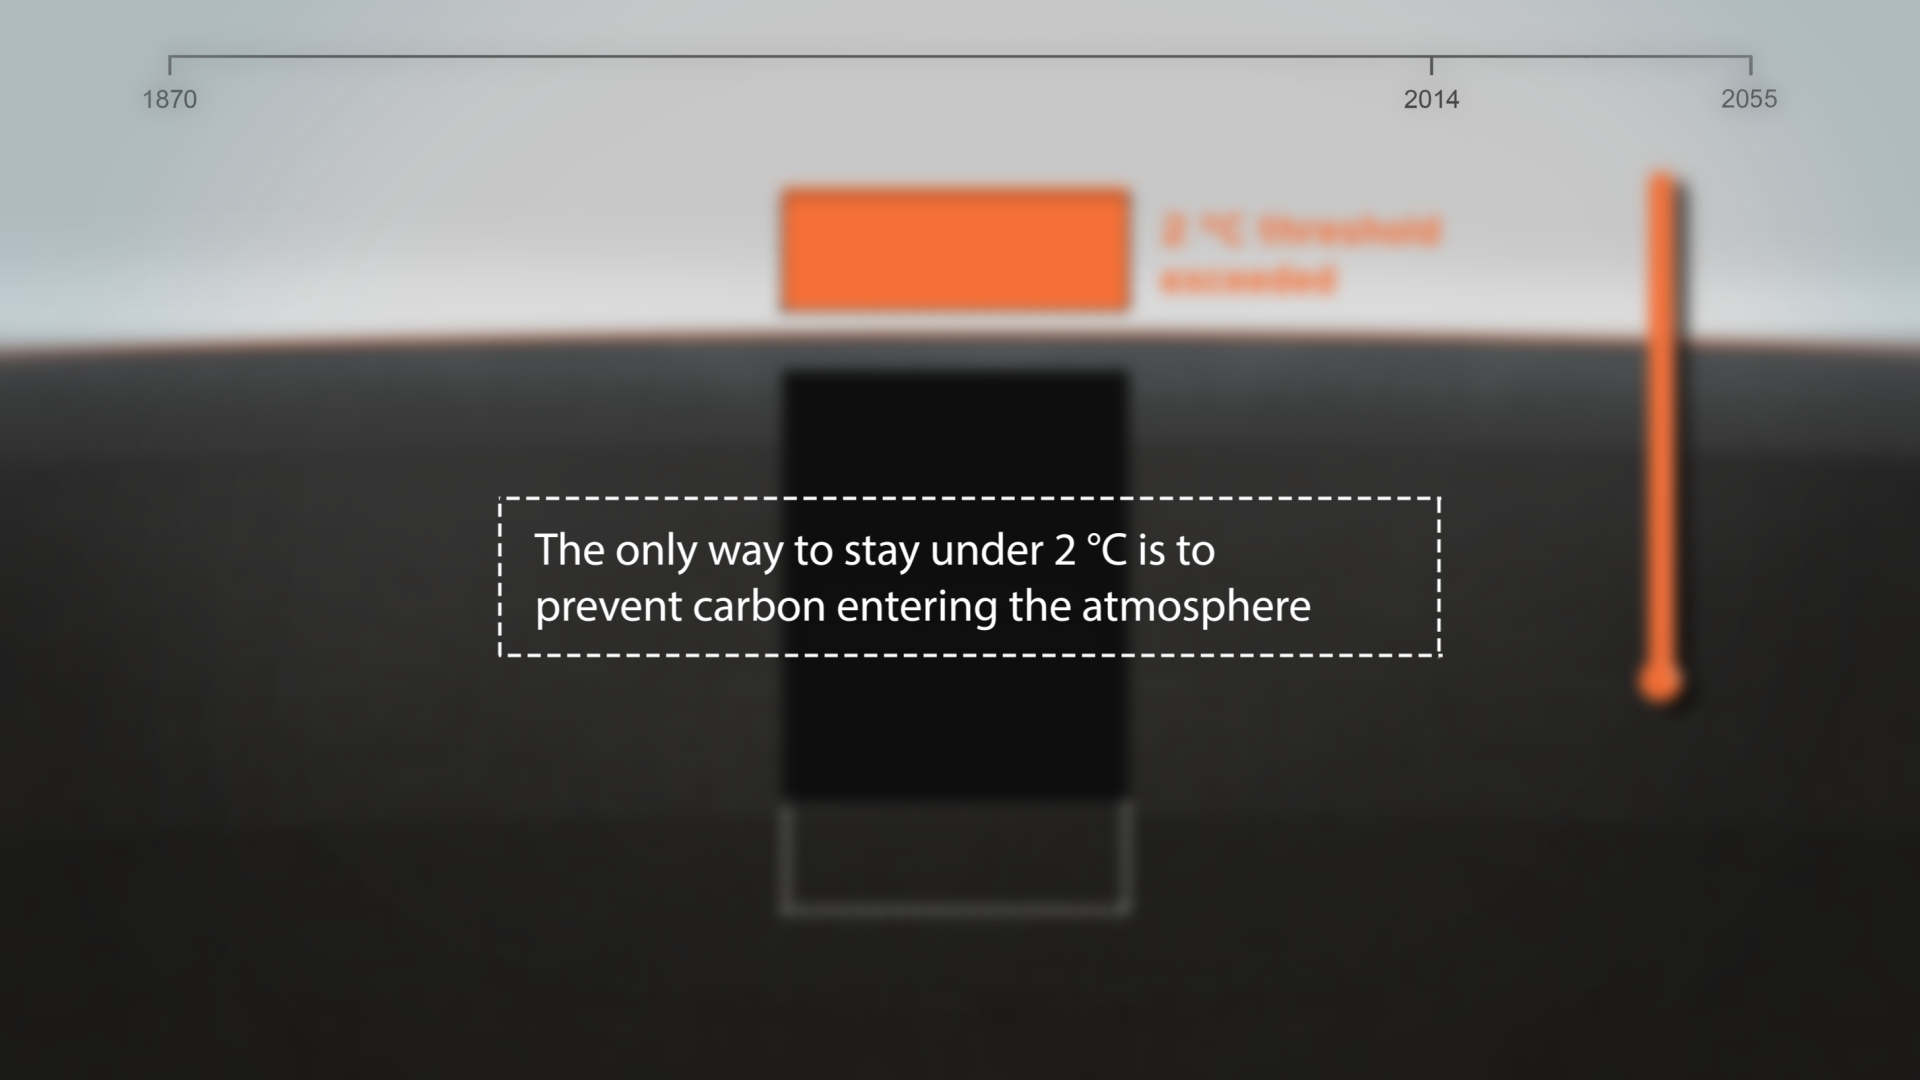
  • carbon capture & storage (CCS) is an essential part of the 2 degrees solution

Technical note
The volumes of coal, oil, gas and CO2 shown in the film are accurate volumes based on best available data. A detailed Technical Data Methodology document has been produced to accompany the film. This shows all data sources, assumptions on future global renewable and non-renewable energy requirements and the potential of carbon capture and storage technology.

See the Methodology Document for more details

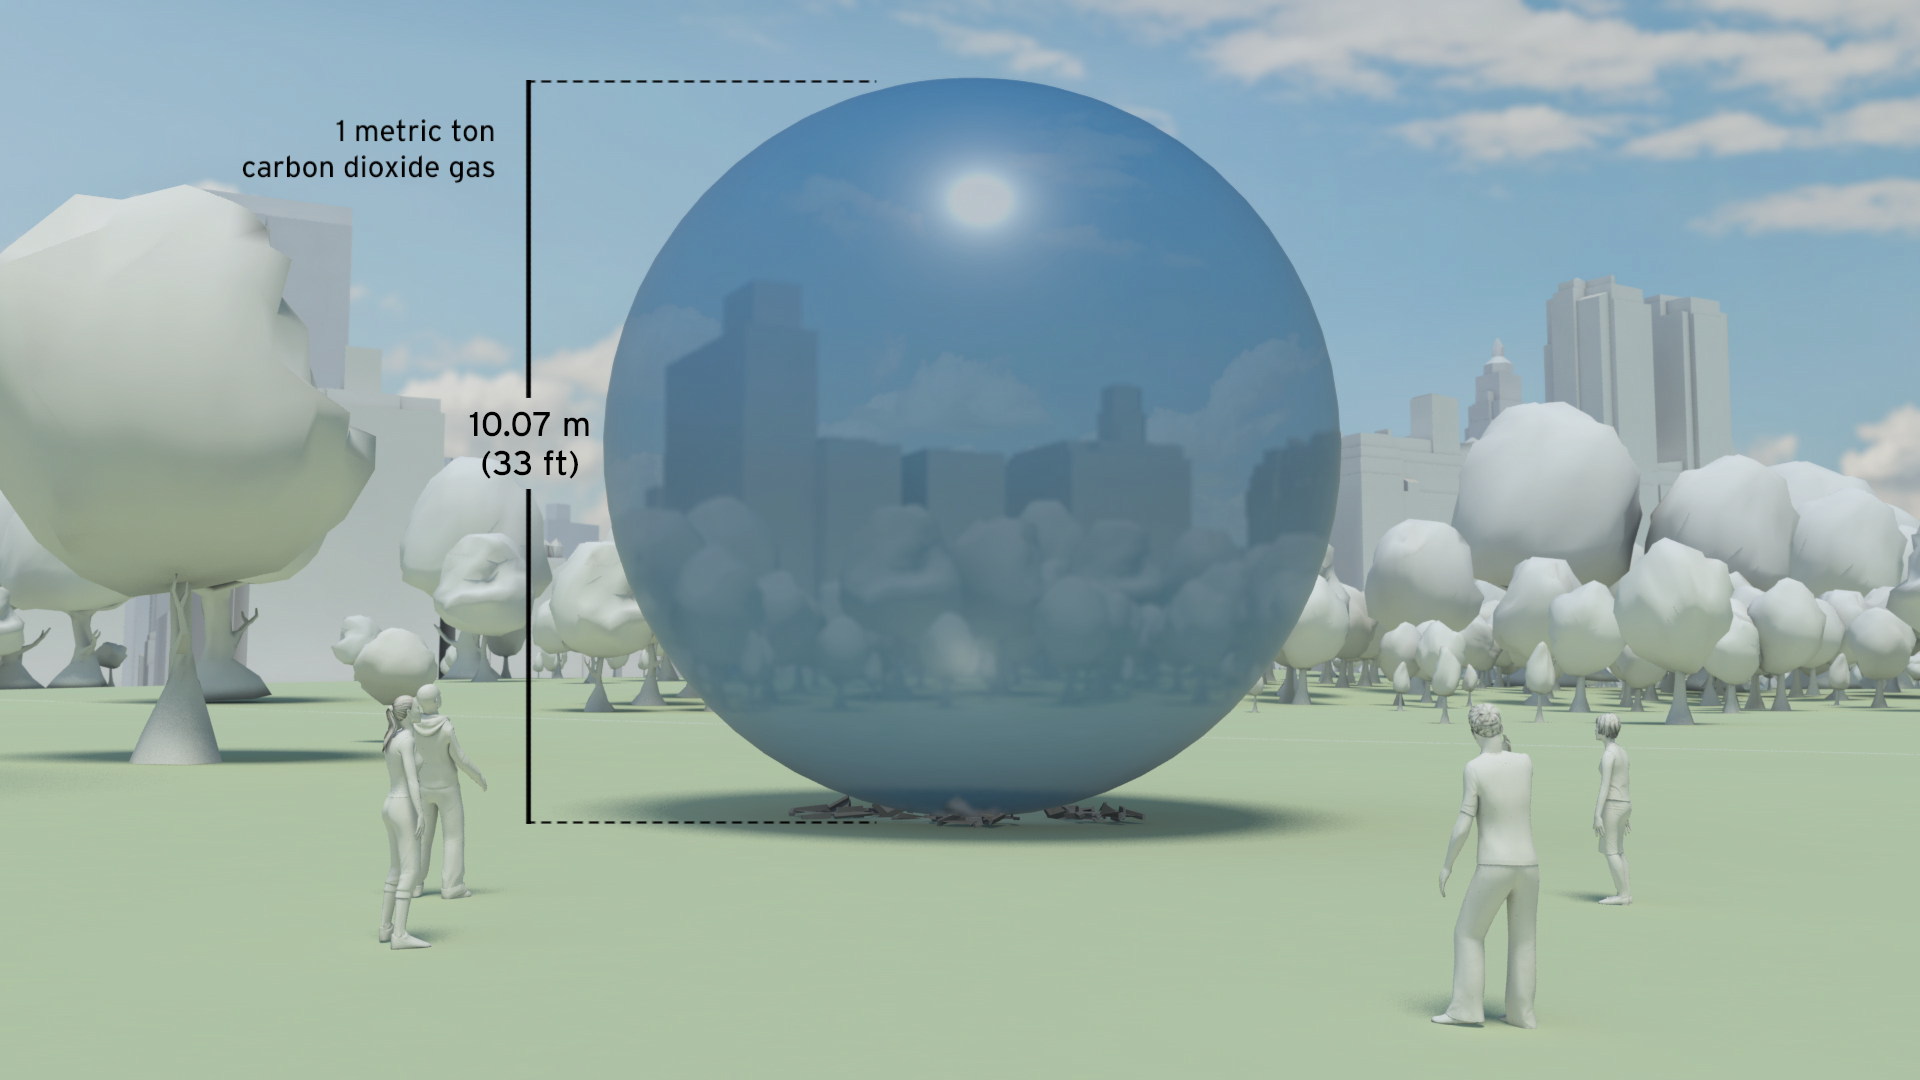
In 2012 we added over 39 billion metric tons of carbon dioxide to the atmosphere. That’s 1,237 metric tons a second. 

It is like a ‘bubble’ of carbon dioxide gas 108 metres across entering the atmosphere every second of every day. We could fill a volume the size of the UN Secretariat Building with our carbon dioxide emissions in less than half a second. We could fill it 133 times a minute.

The pile of one metric ton spheres in the film, which represents one day’s emissions, is 3.7 km high (2.3 miles) and 7.4 km across (4.6 miles).

The world gets through a lot of fossil fuels:

  • 7,896.4 million metric tons of coal a year (21.6 million metric tons per day, 250 metric tons per second)

  • 91,330,895 barrels of oil per day (168 m3 per second)

  • 3,347.63 billion m3 of natural gas per year (9.2 km3 per day, 106,082 m3 per second)

This film tries to make those numbers physically meaningful – to make the quantities real; more than ‘just numbers’.

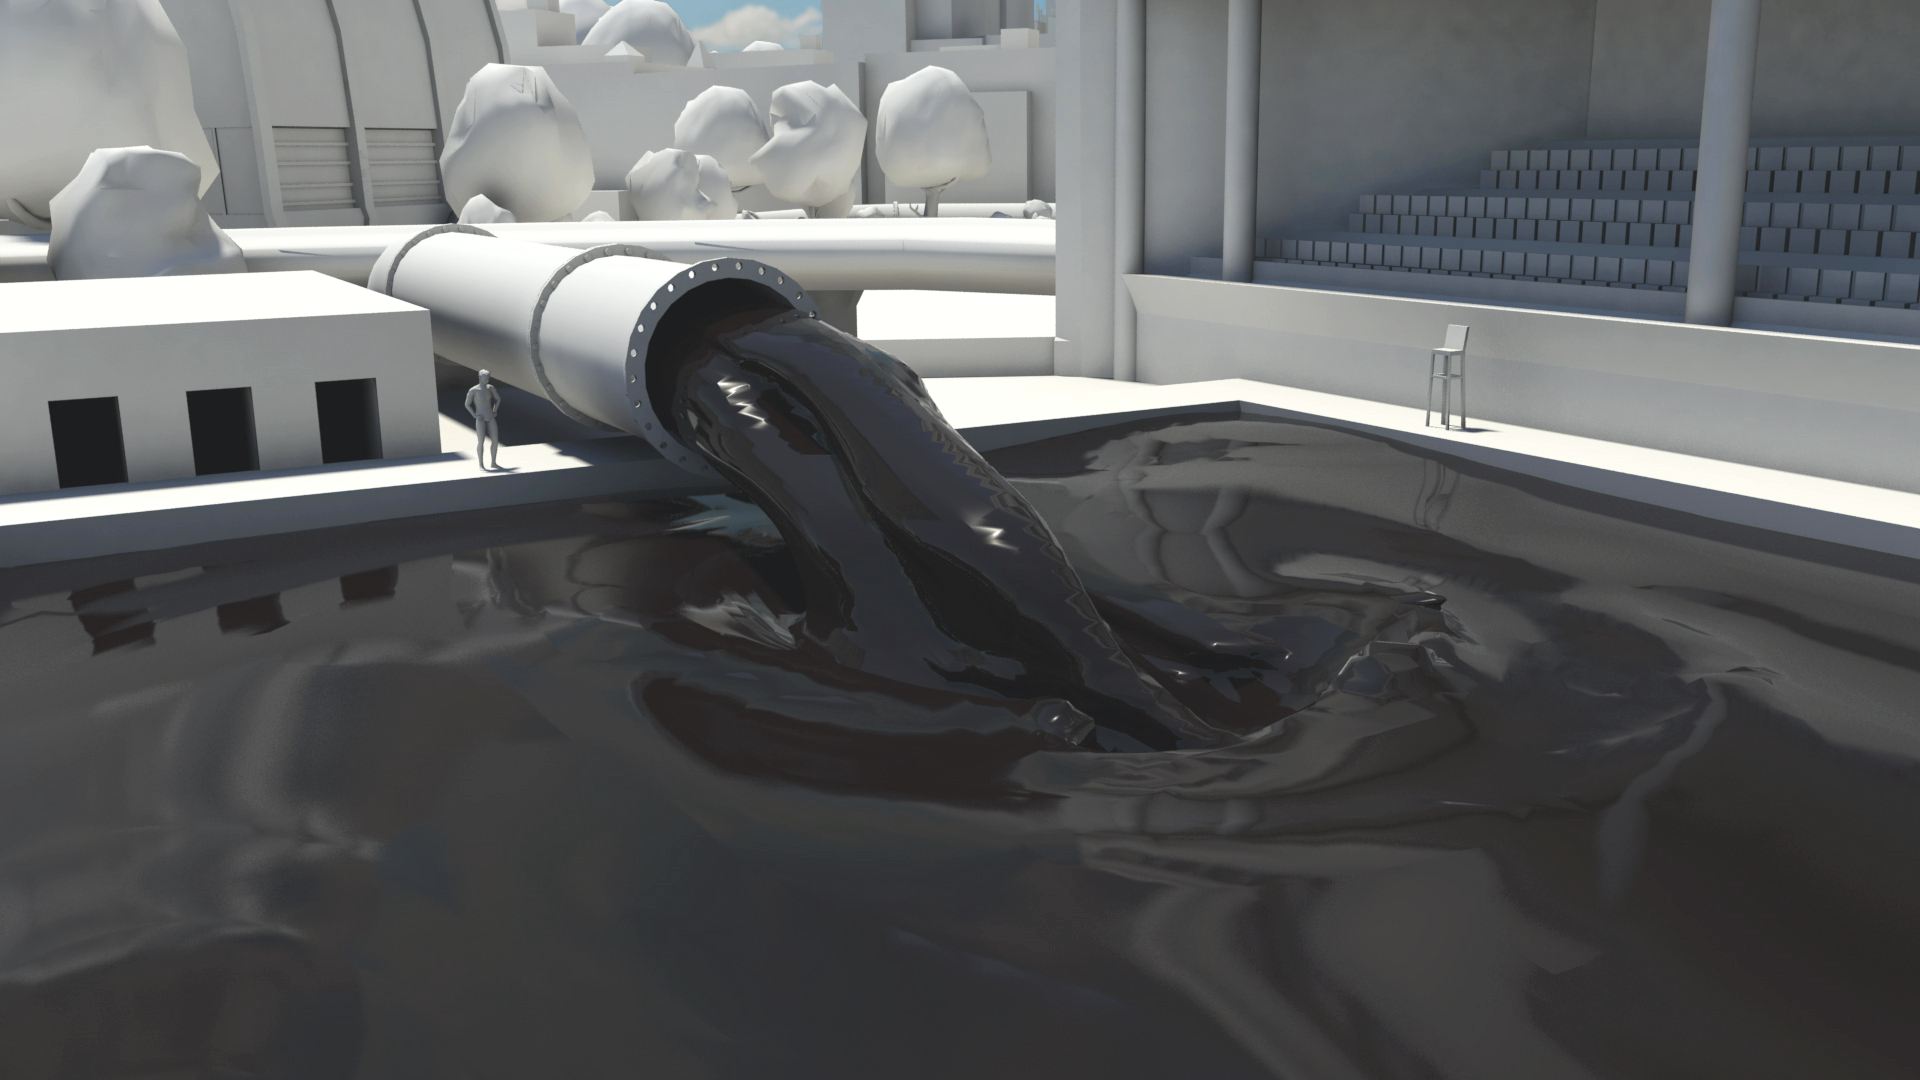
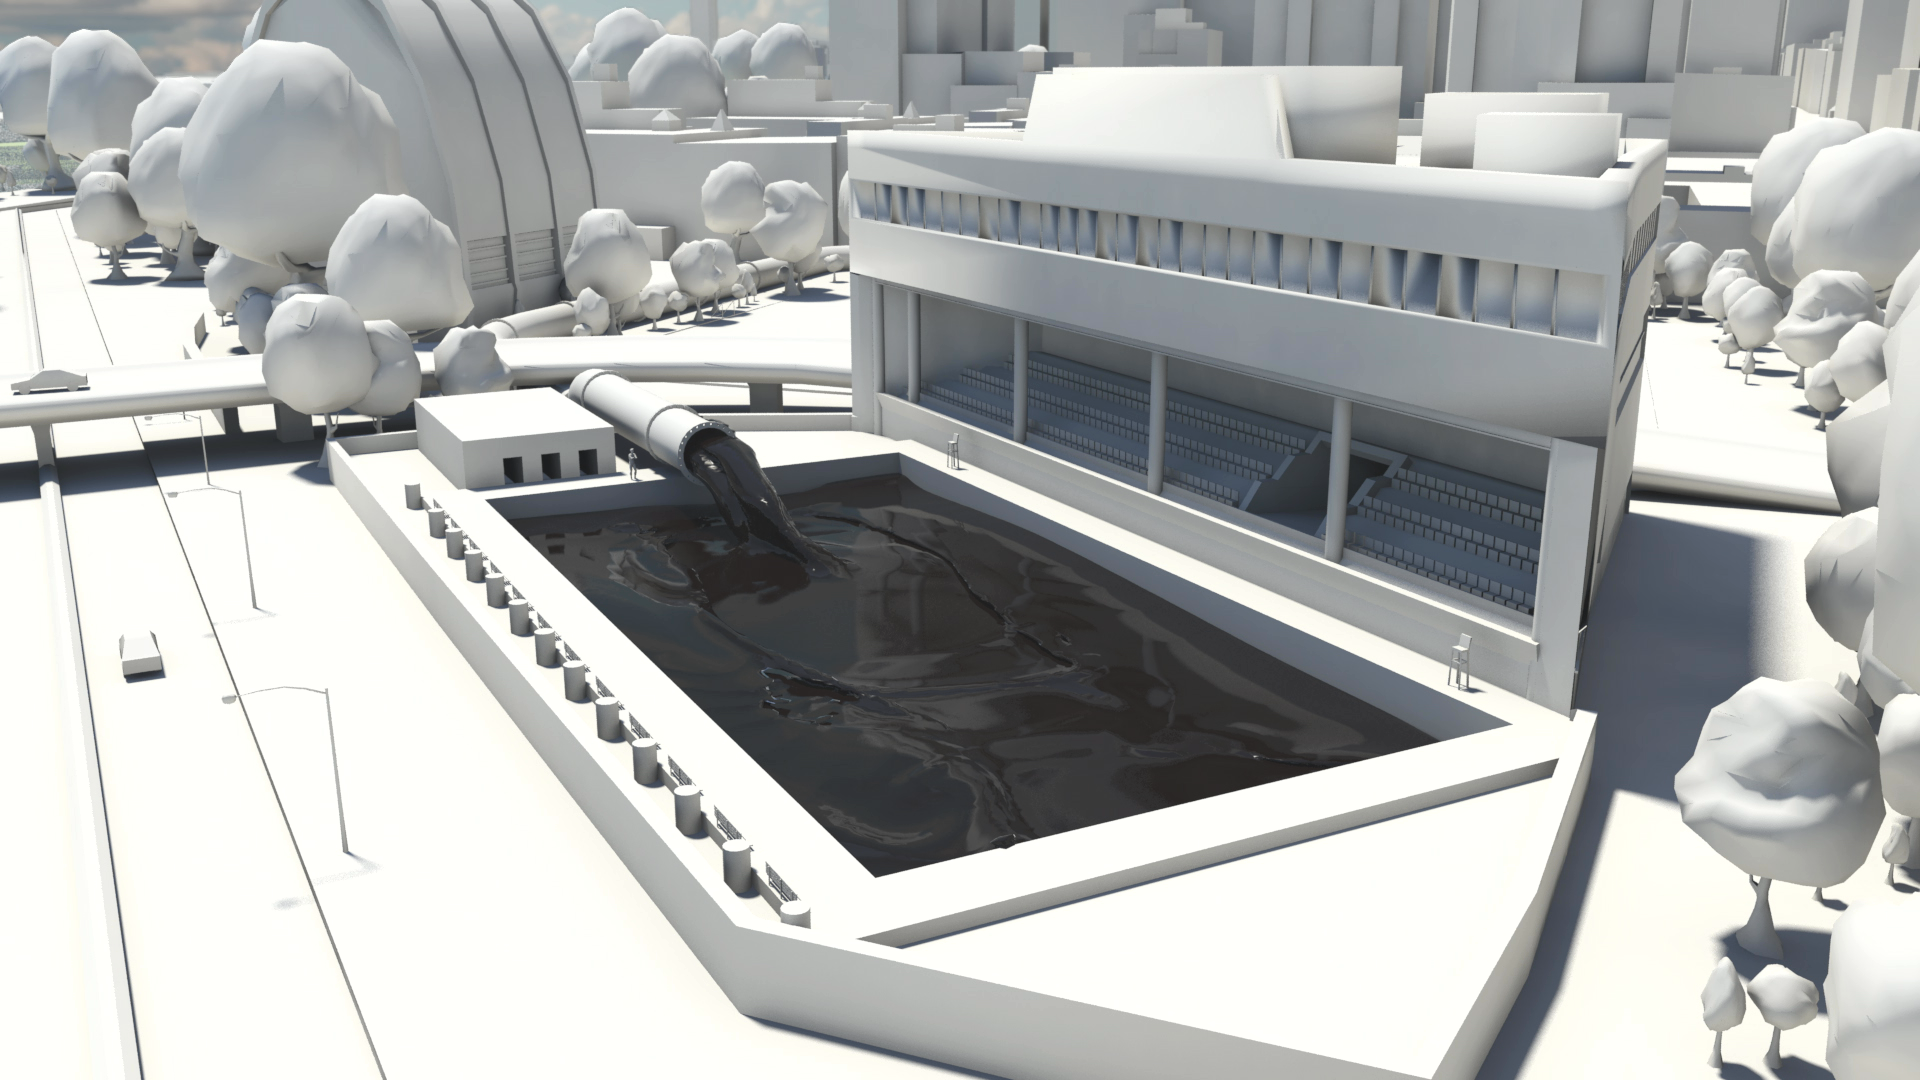
The coal we use each day would form a pile 192 metres high and 546 metres across. We could fill a volume the size of the UN Secretariat Building with coal every 17 minutes.   At the rate we use oil, we could fill an Olympic swimming pool every 15 seconds.

This would fill a volume the size of the UN Secretariat Building with oil every 30 minutes.

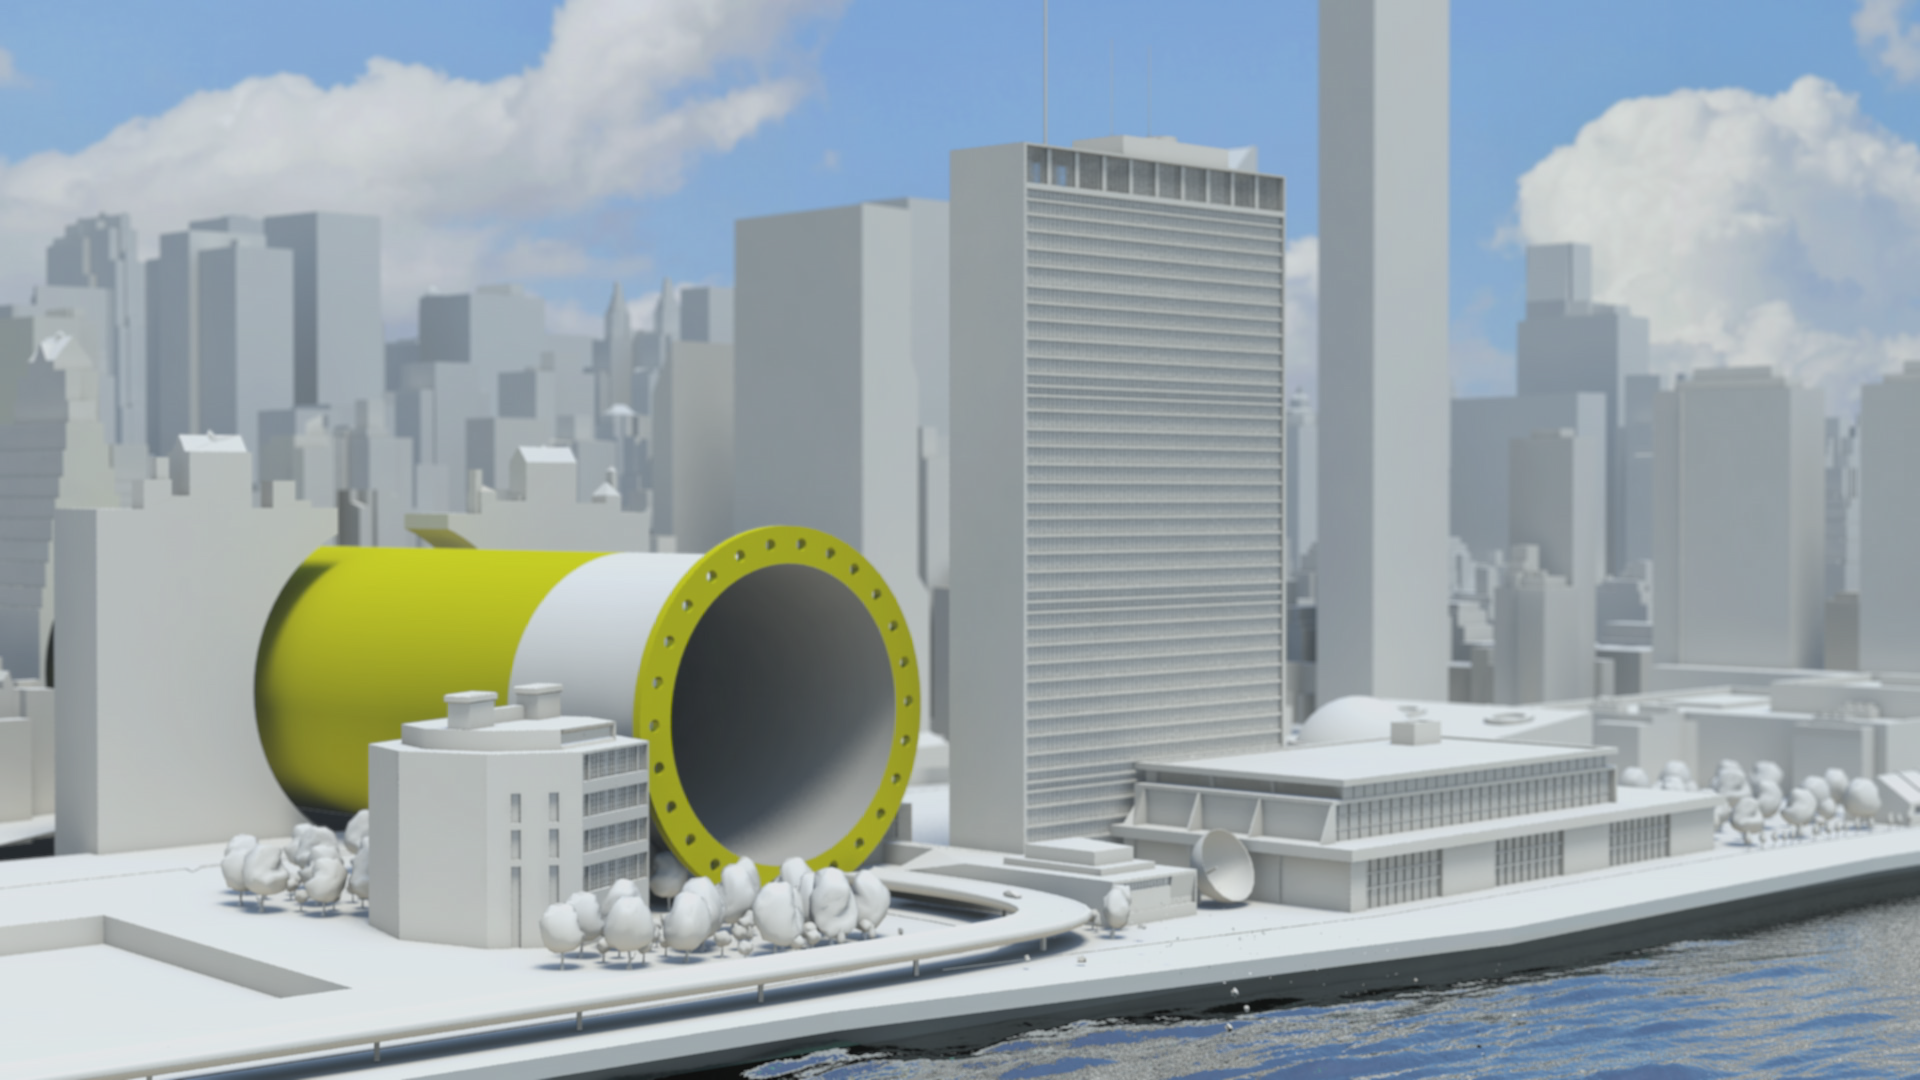
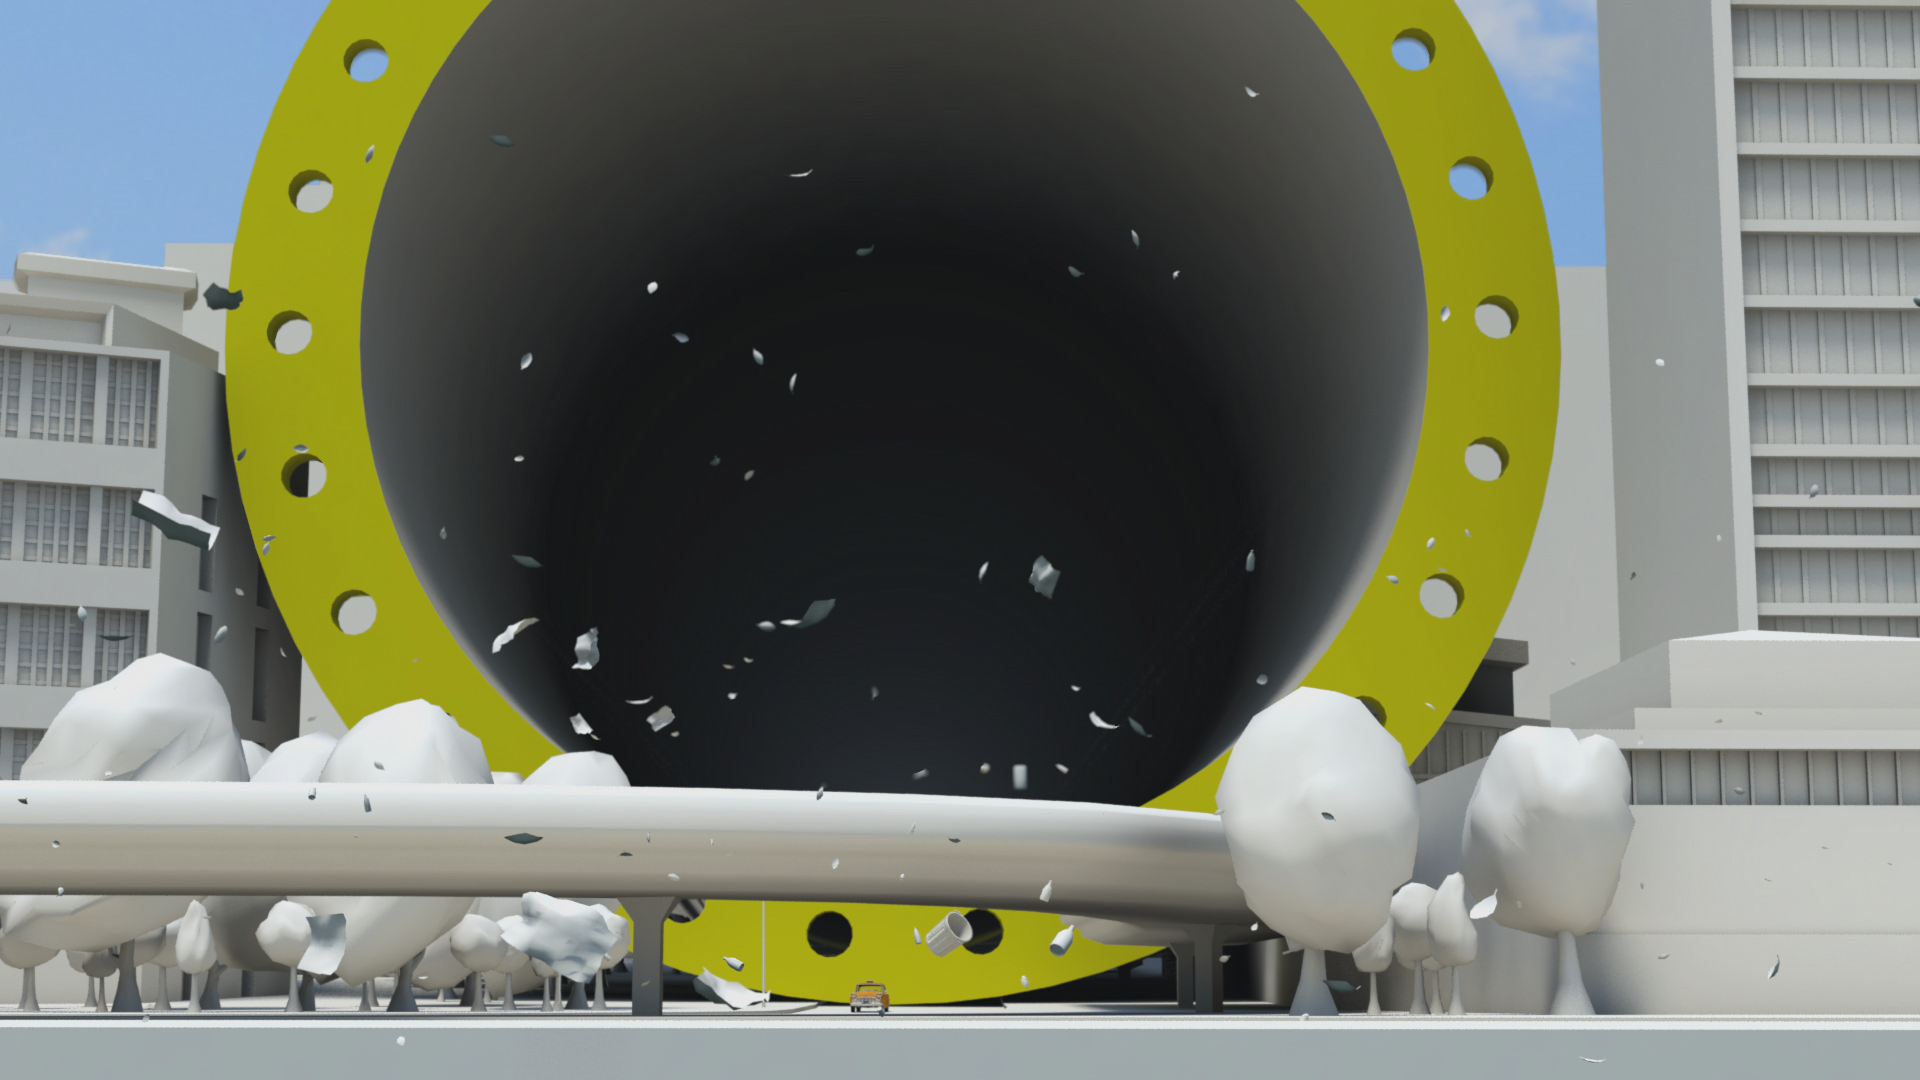
The rate at which we use natural gas is equivalent to gas travelling along a pipe with an internal diameter of 60 metres at hurricane speeds (135 km/h / 84 mph). We could fill a volume the size of the UN Secretariat Building with natural gas in under 3 seconds.

We use a cubic kilometre of gas every 2 hours 37 minutes and a cubic mile of the stuff every 10 hours 54 minutes.

A set of shorter clips has also been released, featuring some of the most impactful scenes of the main film. These are intended for use by everyone, from industry through to educators and campaigners. Get in touch if you would like hi-res versions.

Main film and extract films can be viewed on YouTube:

Whole film

Fossil Fuels Extract

Carbon Dioxide Extract

Natural Gas Extract

Oil Extract

Coal Extract

All images are available under Creative Commons licence to download on our Flickr page

See blog background story.

Making sense of carbon, trees and timber

CLIENT

Wood for Good

PURPOSE

To find a new way to communicate the carbon benefits of using wood and timber in the UK construction sector.

DESCRIPTION

A series of short animated films and case study images using Wood for Good’s data to reach construction professionals, policy makers and the public.

The competence and skill you have in handling large data sets is absolutely fantastic. And you still delivered a wonderful set of visuals for us that we can continue to use for a long time to come.

Craig White Chairman, Wood for Good

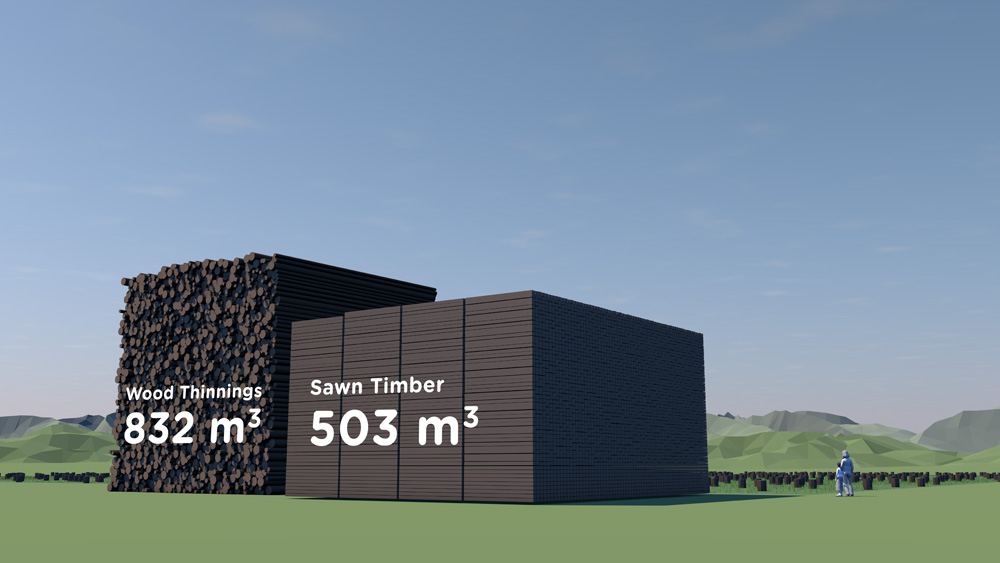
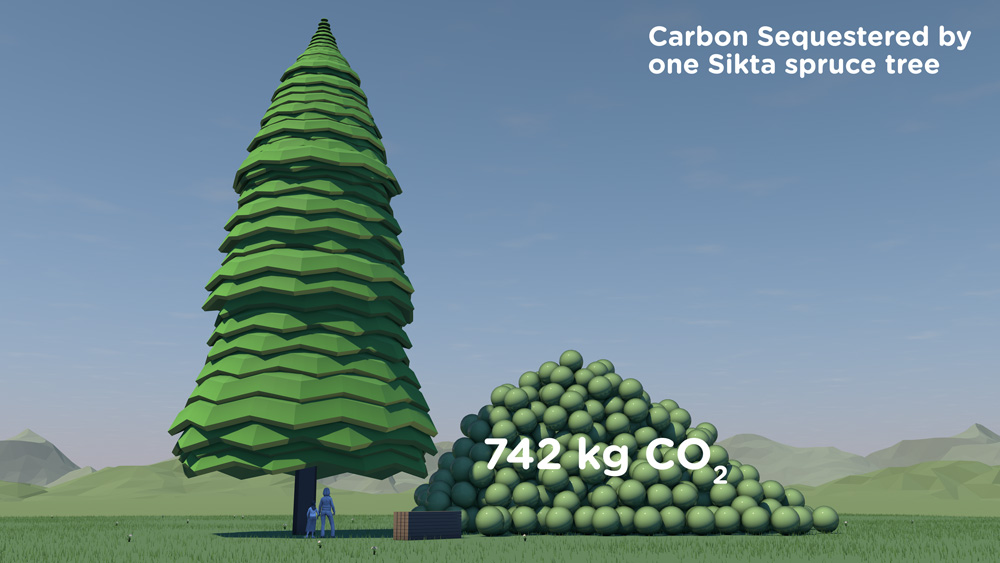
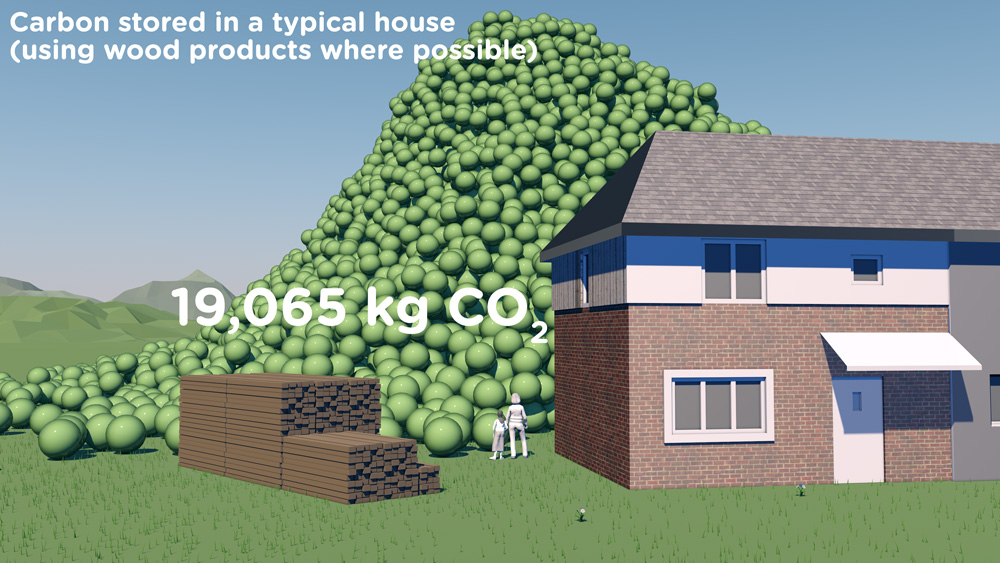
How much carbon is stored in a tree? How does that translate into cut timber and wood products? And how much carbon can be ‘banked’ by using timber for building houses in the UK?

These questions are raised and answered in a communication project that includes a series of short animated films and set of case study images created by Carbon Visuals for Wood for Good, the UK's wood promotion campaign.

The aim was to find a new way to communicate the positive carbon benefits of using wood and timber in the UK construction sector not just to construction professionals but also policy makers and the public.

Given the wide nature of the brief we agreed with the client to start the project with a scoping phase. During this, it was decided to split the film into three separate sections that could each work as short stand-alone films, rather than only as one single complex narrative. In addition we agreed to create a set of case study best practice images showing the carbon ‘banked’ in high profile buildings and timber products.

It has been very satisfying to shape and create a project which has both a business focus and important educational potential. I would like to see us working with more trade bodies and campaigns that have an important carbon message to get across.

Antony Turner, CEO Carbon Visuals

By liaising closely with the client in this initial phase we were able to spend time working up a communications plan, sourcing and examining appropriate data and creating draft film storyboards. This established a sound basis for the production schedule, culminating in all visual materials being ready for the campaign launch.

Data Sheet with methodology, data and references available here.

See Wood for Good website page here.

See our post-production video (giving insight from our clients on the project) here.

Illustrating the world’s first Carbon Neutral Engine Oil

CLIENT

Castrol Professional

PURPOSE

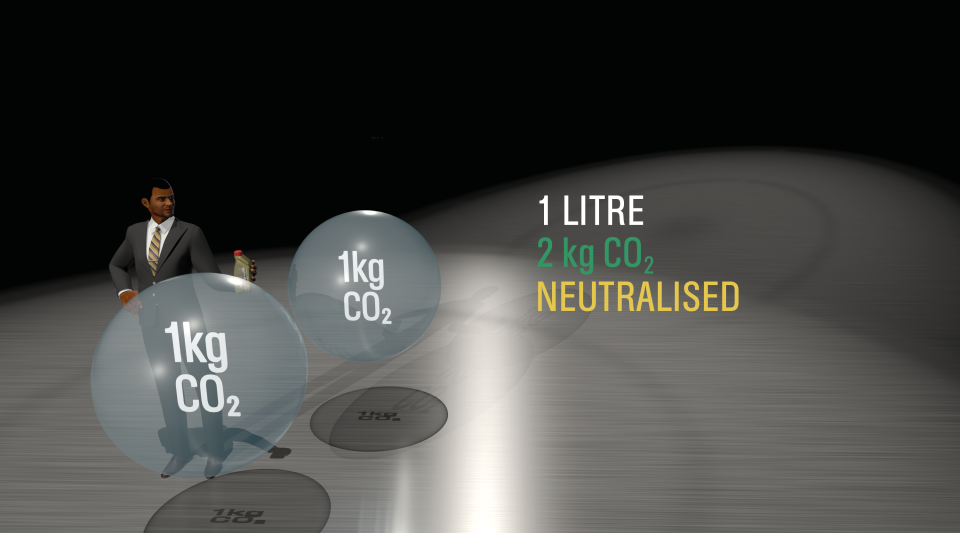
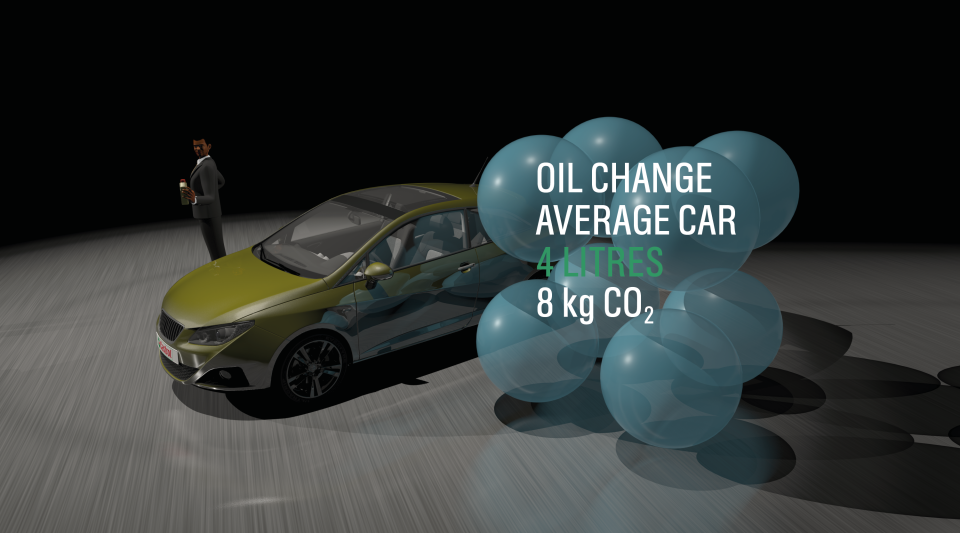
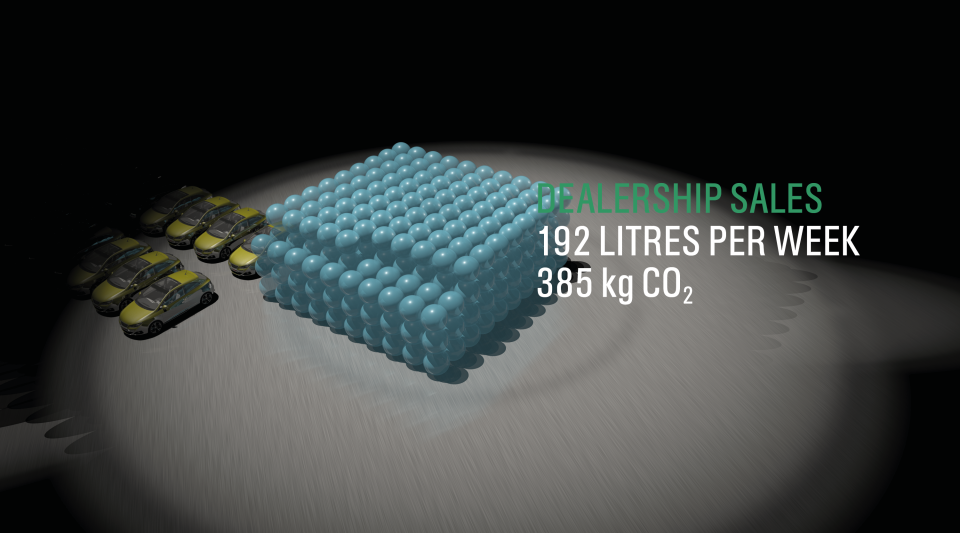
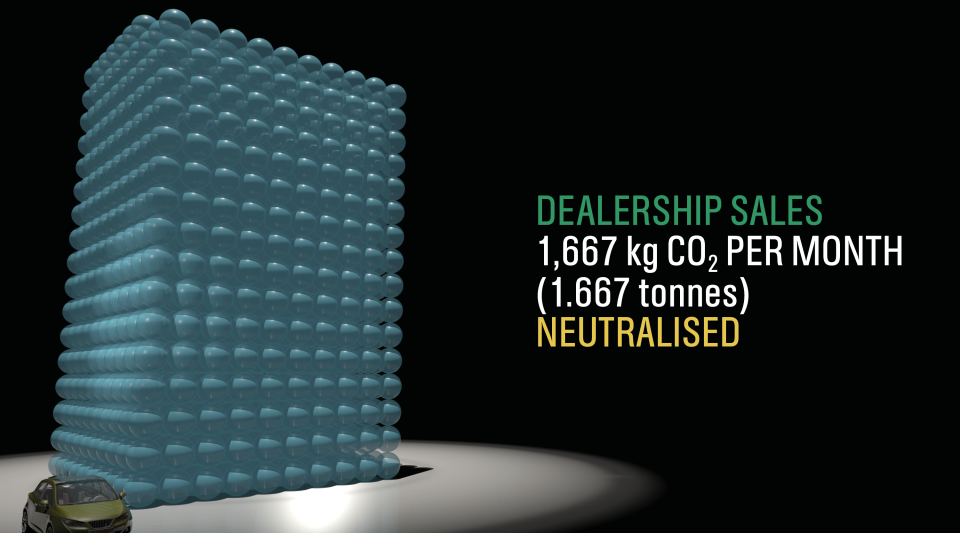
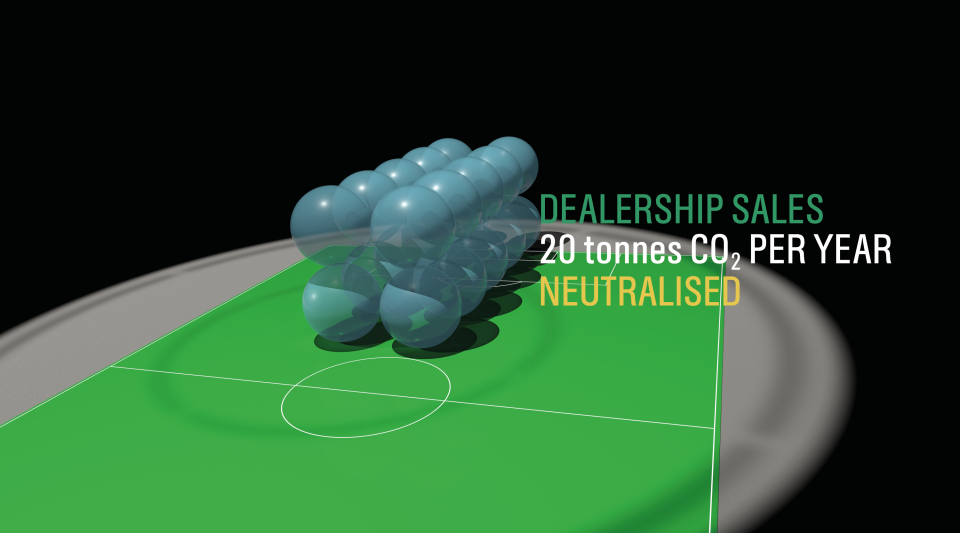
To help their dealers understand that although the amount of CO2 offset for a single one litre pack of engine oil might be small (2 kg), it adds up. Particularly when seen from the point of view of a whole country, or indeed world sales.

DESCRIPTION

An animated film for the European dealer launch at CERN in Switzerland of ‘the world’s first CO2 Neutral Engine Oil’.

A resounding success - thank you for turning this round so quickly. We are very happy with the final product and it was well received last week at CERN.

Adrian Pask, Global OEM Offer Development Manager Castrol Professional

How do you visualise carbon offsetting? This is, after all, carbon removed from the air to mitigate actual emissions. That was the challenge facing us when asked by Castrol Professional to create an animated film for the European dealer launch at CERN in Switzerland of ‘the world’s first CONeutral Engine Oil’.

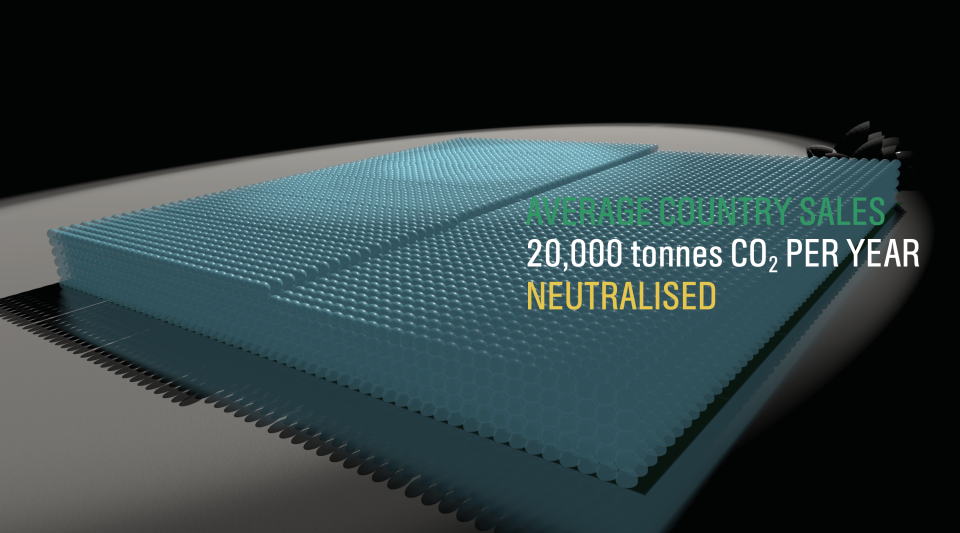
Castrol wanted a way to help their dealers understand that although the amount of CO2 offset for a single one litre pack of engine oil might be small (2 kg), it adds up. Particularly when seen from the point of view of a whole country, or indeed world sales.

Rather than showing the CO2 emitted in the manufacture of a consumer product, our role was to show that Castrol ‘neutralised’ those emissions. We set about writing and developing a story-board that could be animated in record time (we had less than a month to complete the project).


Background

Castrol Professional products have become the first CO2 neutral engine oils in Europe. EDGE Professional, MAGNATEC Professional and GTX Professional have all been certified CO2 neutral according to BSI PAS2060, a standard for measuring and managing the CO2 footprint of a product’s life cycle.

The company underpins its CO2 neutral claims with good science including reduction in the manufacturing process. It offsets the remaining CO2 by investing in a portfolio of emission reduction projects such as reforestation in Kenya, clean electricity generation in China and wind farms in New Caledonia.

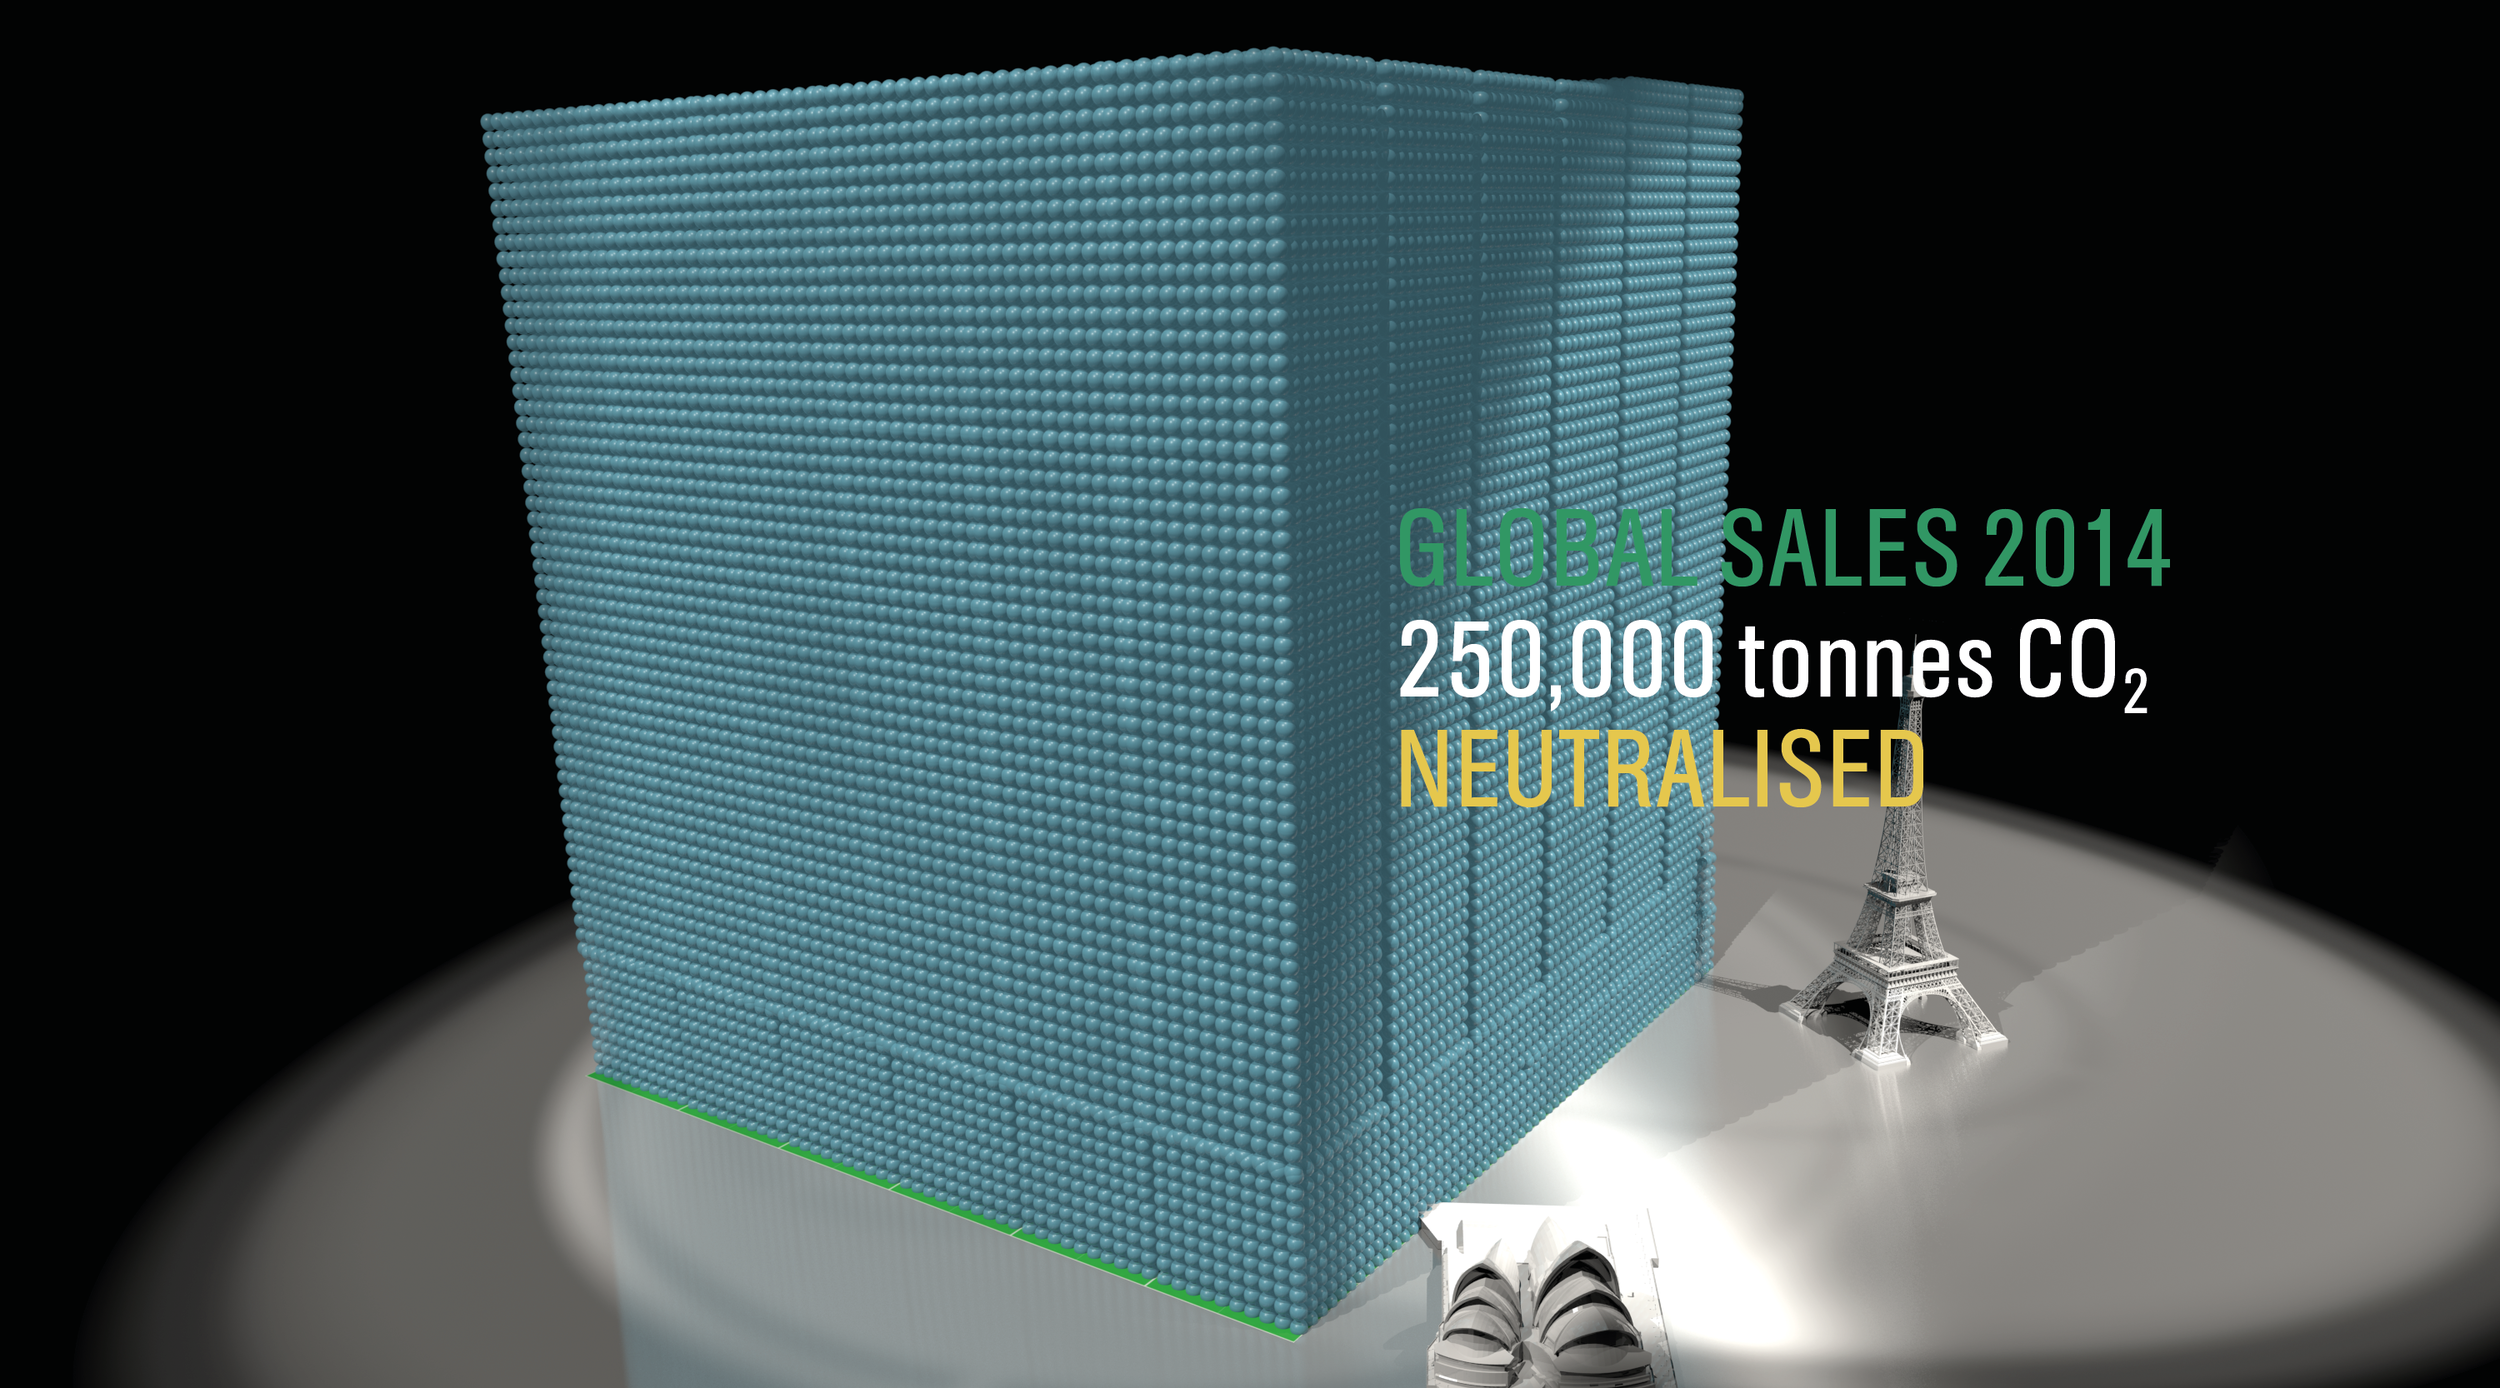
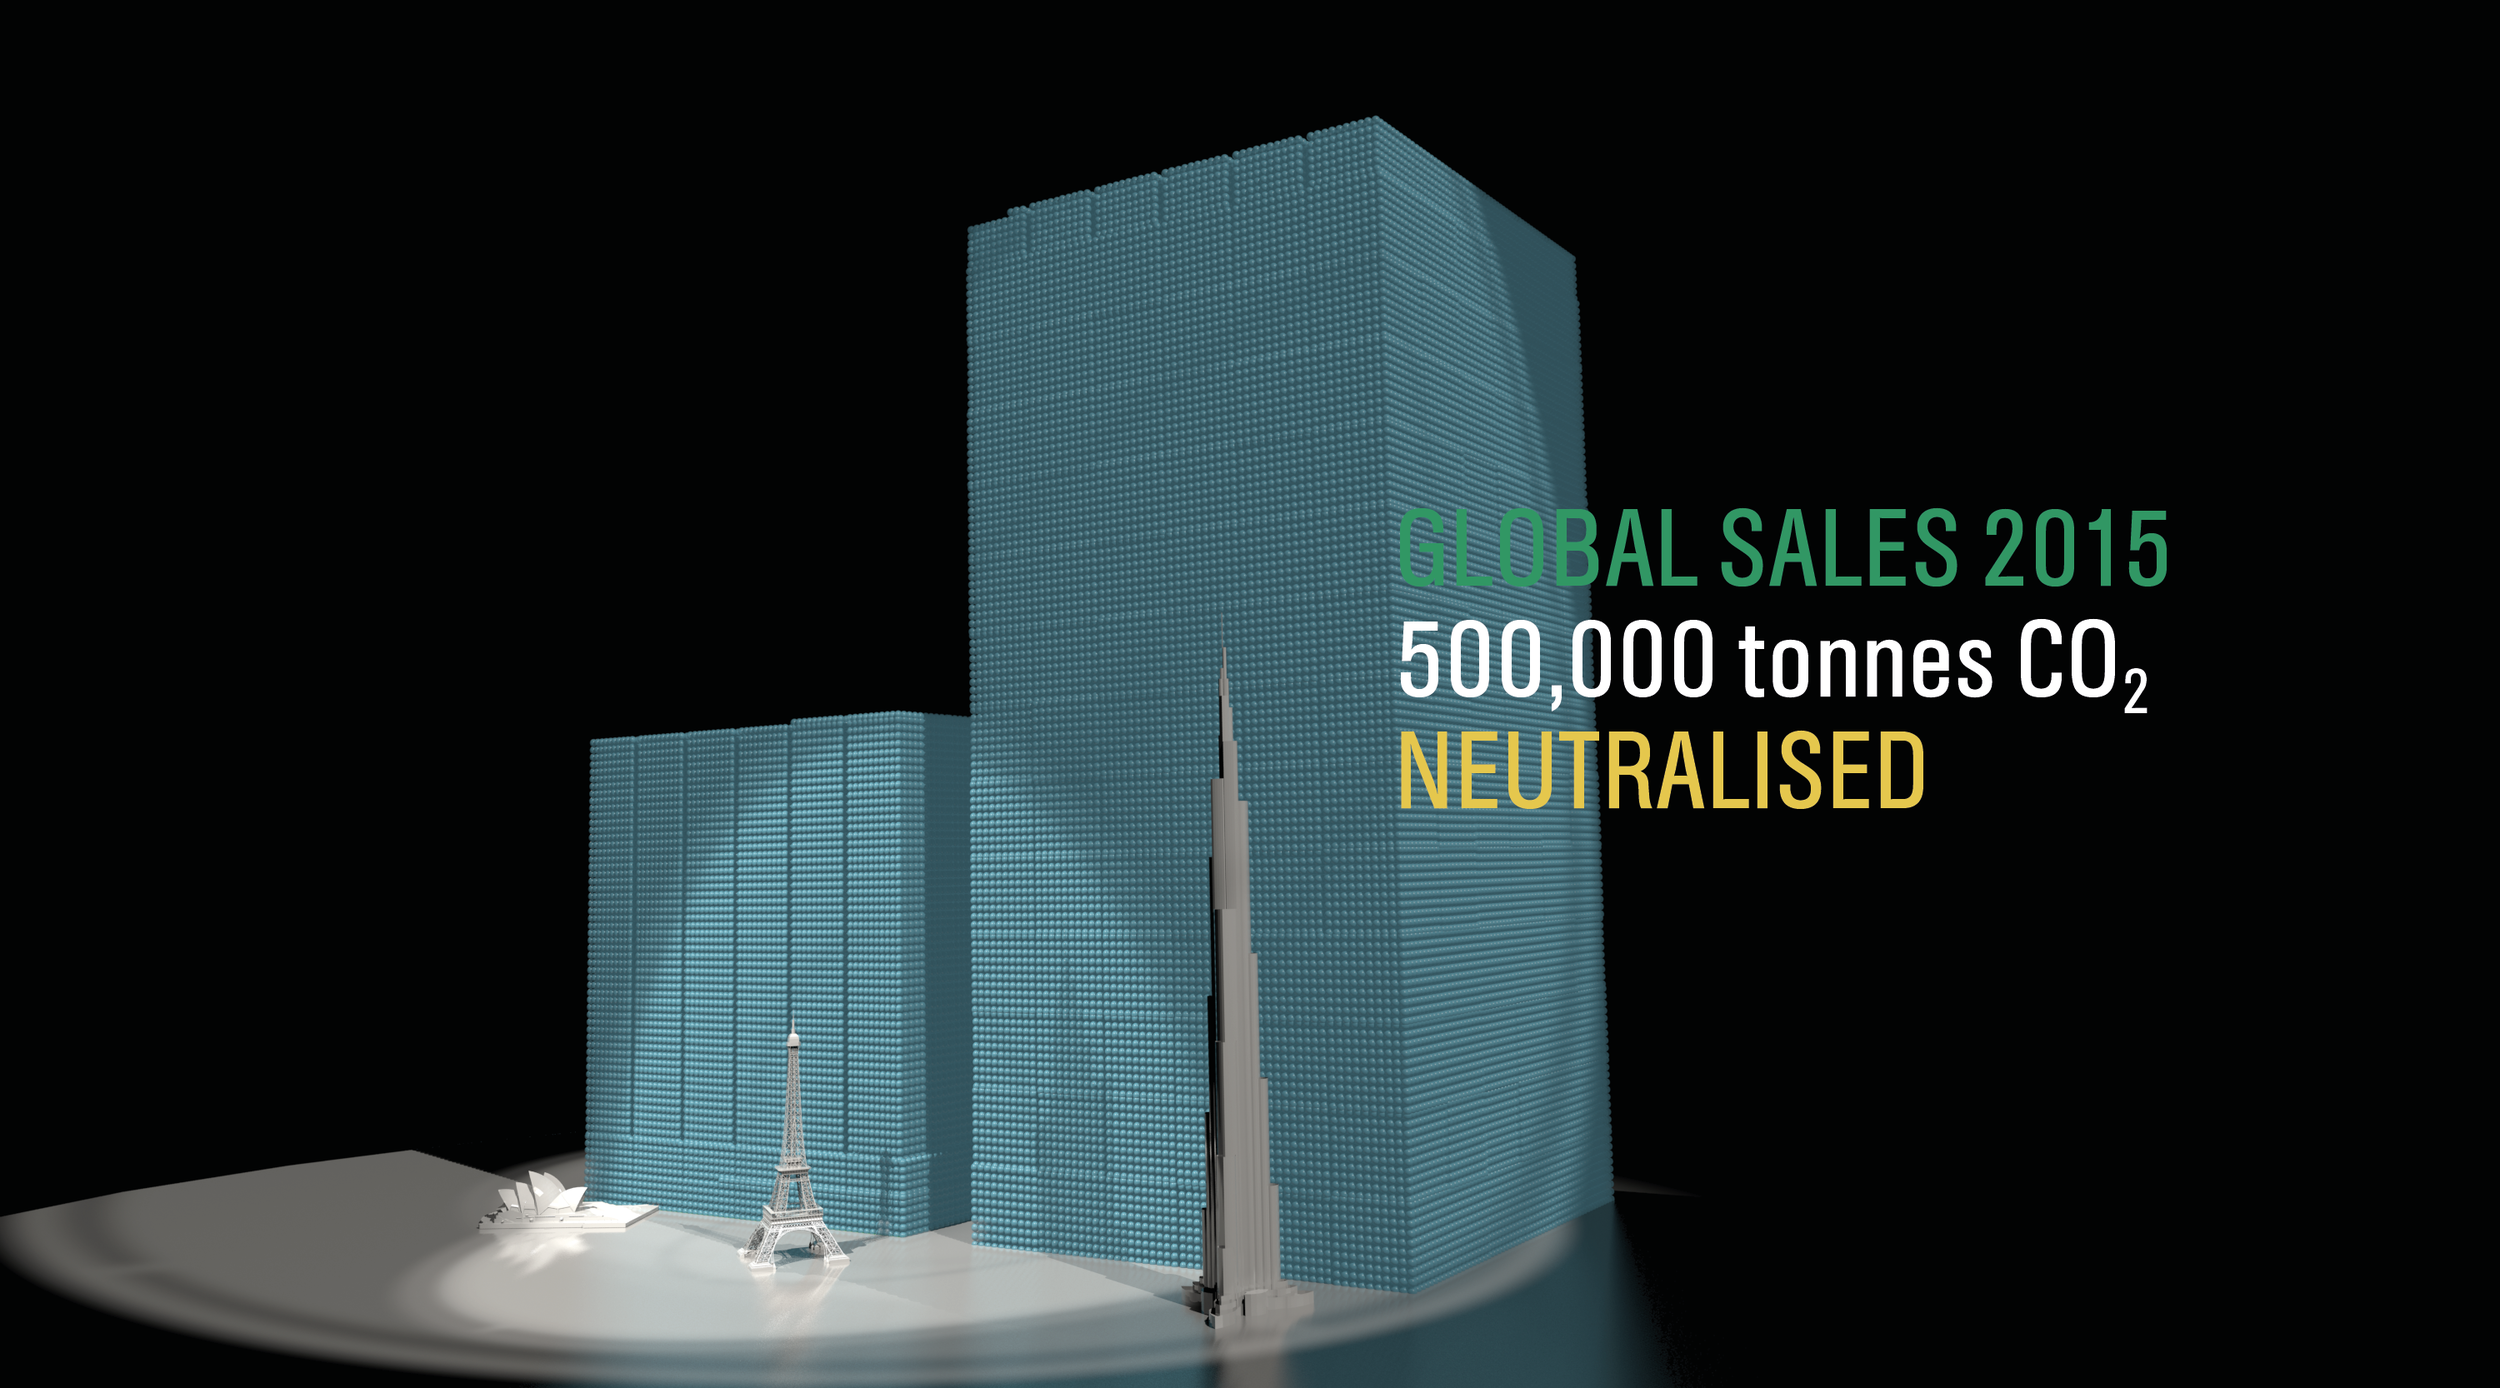
In 2014, 200,000 tonnes of CO2 are likely to be neutralised globally by Castrol Professional. This figure is expected to grow to nearly half a million tonnes annually the following year.


More on Castrol Professional

More on CO2 reduction projects being supported by Castrol Professional

Tackling CO2 emissions is a major issue for the automotive industry globally and Castrol Professional has made this a central part of our working relationship with manufacturers and dealers, as we develop ever-more sophisticated engine oil formulations.
This is a practical step towards a longer commitment to innovate sustainably through continued technological and scientific advancement.

John Ward-Zinski, Global Brand Director Castrol Professional

To cover so many visualisations in 90 seconds with a strong product focus was potentially a tall order. Looping our narrative through a virtual world within the pack itself encourages viewers to explore and re-explore this complex story.
Dave Forman, Project Manager / Designer Carbon Visuals

The brevity and directness of this film gives staff, dealers and consumers an easy and quick feel for the product and emissions saved on a range of scales from a litre to half a million tonnes.

Antony Turner, CEO Carbon Visuals

Visualising a 90% carbon reduction

CLIENT

Interface

PURPOSE

To show the 90% carbon reduction achieved since 1996 at the European manufacturing facility in the Netherlands.

DESCRIPTION

Short animation that can be used on social media together with before and after images showing the Scherpenzeel factory and surroundings with the dramatic reduction in emissions.

In the past three years we have taken huge strides towards our Mission Zero goal.
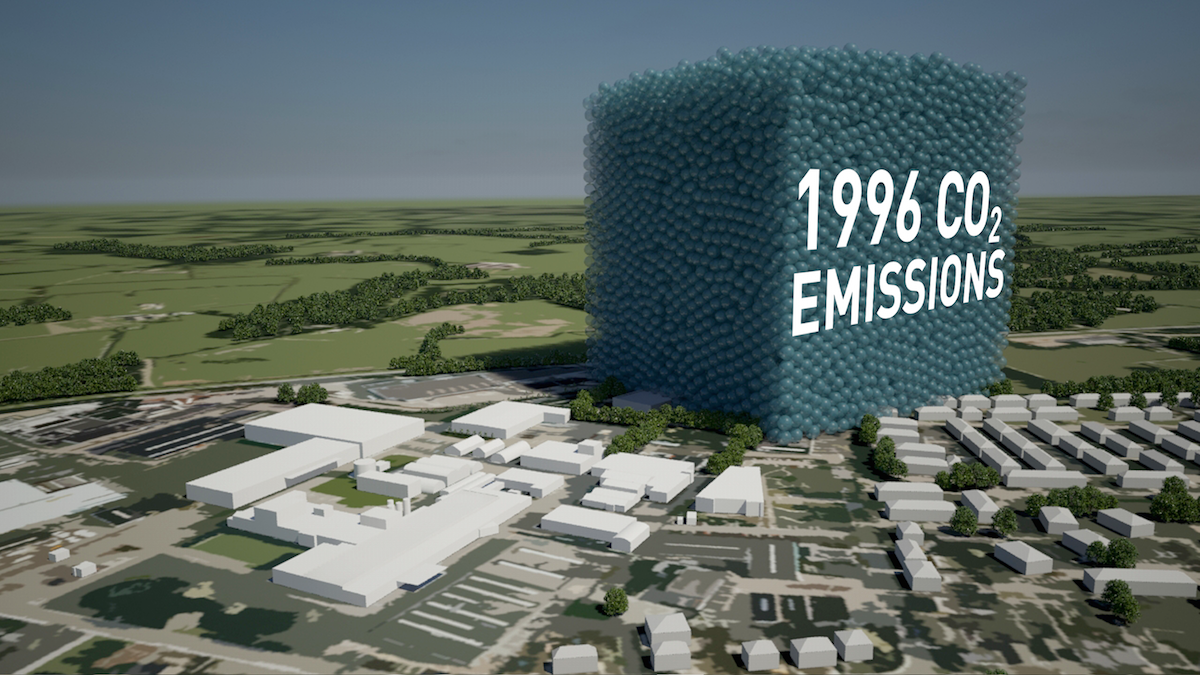
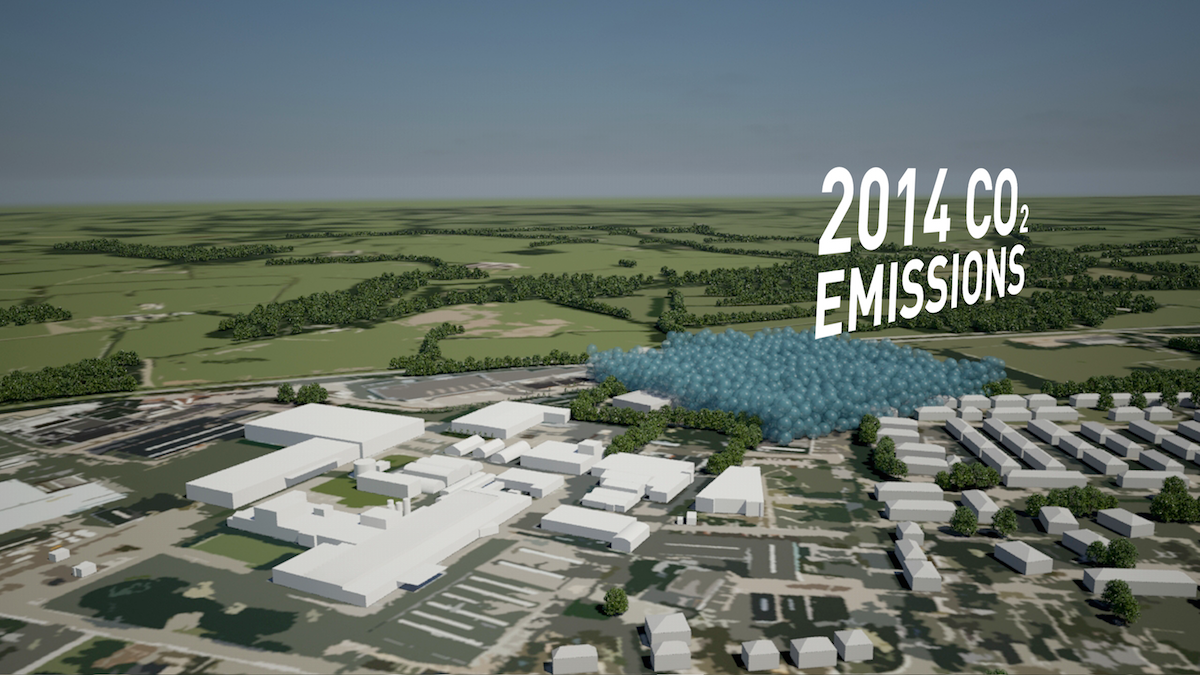
To put it in context, we are now operating our European factories with a 90% reduction in greenhouse gas emissions compared to 1996 while the EU Commission has set an EU carbon reduction target of 40% by 2030.

Rob Boogaard, CEO Interface Europe

Carbon Visuals has helped Interface, the carpet tile manufacturer and pioneer in corporate sustainability, show the impressive 90% carbon reduction achieved since 1996 at its European manufacturing facility in the Netherlands.

We created a 3D model of the Scherpenzeel factory and surrounding area and populated it with our trademark ‘carbon bubbles’. Deliverables included volumetrically accurate ‘before’ and ‘after’ images as well as a short animation that can be used on social media or as part of a longer video.

See this animation on YouTube

Interface info on achieving 90 carbon reduction

Infographic illustrating how the emissions reduction has been achieved.

Video: A better way - Interface Europe achieves 90% CO2 reduction

Sequestered carbon in innovative building panels

ModCell is a novel and innovative building system that brings the benefit of straw bale construction - exceptional levels of insulation - into the mainstream of the construction industry. Carbon Visuals was asked to provide images to show the sequestered carbon dioxide in panels and in a recently completed project - a school science centre in Bath.
The carbon footprint of one hour's TV production

CLIENT

BBC

PURPOSE

To illustrate the emissions resulting from TV production for an industry conference at White City.
DESCRIPTION

Animation that shows the real-time emissions associated with making one hour of broadcast ready production, and image set.
The television industry is taking steps towards addressing sustainability issues associated with TV productions. A key tool, created by the BBC and made available through a partnership with BAFTA, is Albert - a bespoke carbon calculator.

Carbon Visuals was commissioned by the BBC to produce a set of images and a real-time animation showing the emissions resulting from one hour of TV programming. The data was provided by about 80 productions that were the first to use the Albert calculator at the BBC.

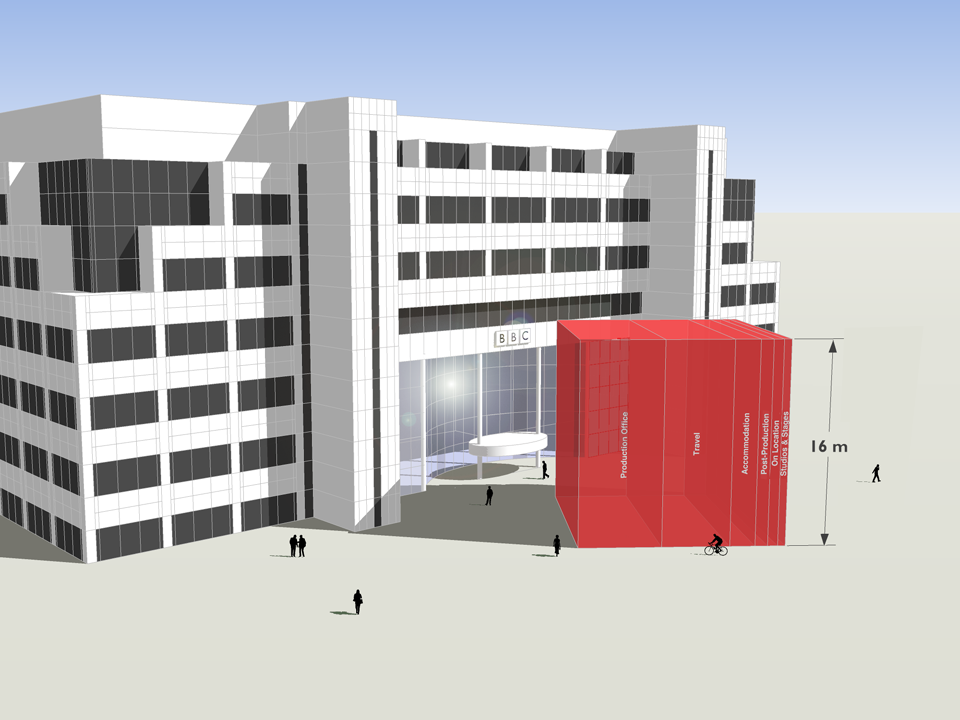
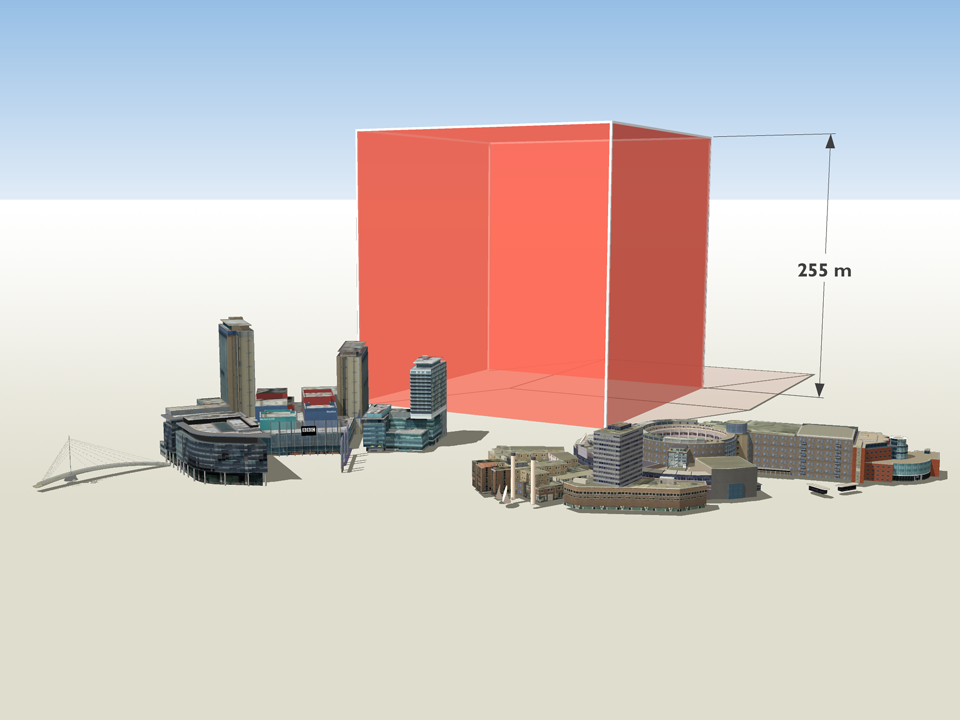
This animation was created for the BBC and shows the real-time emissions associated with making one hour of broadcast ready production - equivalent to about 8.2 tonnes of carbon dioxide.

Average emissions associated with the major stages of a production are here shown in order of size and as a whole, depicted in front of the BBC White City building.

These visuals were first shown at an industry conference, which took place in the iconic BBC White City building that is depicted here, on 3rd November 2011.

The PDF illustrates the emissions of different parts of the production process.

Albert was developed & trialed within the BBC in 2011, with production managers and coordinators providing data on about 80 programmes. While there were considerable variations between productions, the average (mean) rate - about 8.2 tonnes of carbon dioxide per hour - provides a first attempt at establishing a figure against which programme makers will be able to gauge progress in future.

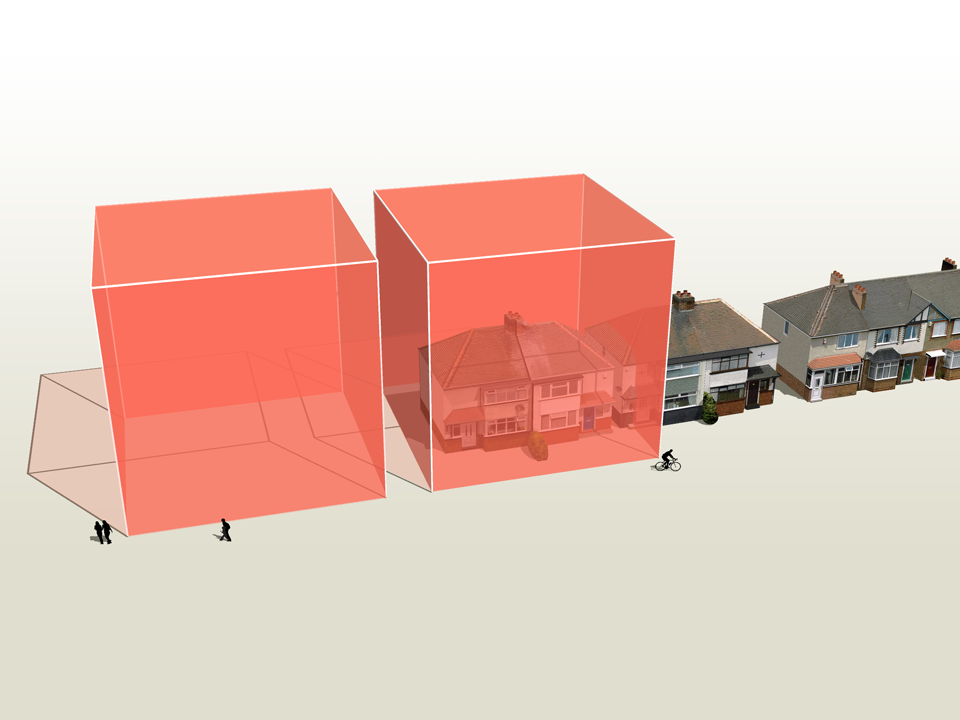
Annually within the BBC, about 3,800 hours of TV are produced in-house. An annual volume of emissions, based on the average rate per production hour for programme emissions calculated using Albert, is here shown with familiar BBC buildings in Salford and London for scale.

The average (mean) rate of emissions associated with TV production, based on data from about 80 programmes, is about 8.2 tonnes of carbon dioxide per hour.

This is roughly equivalent to the annual emissions associated with space heating, heating and lighting for a pair of semi-detached houses (figures provided by the BBC).

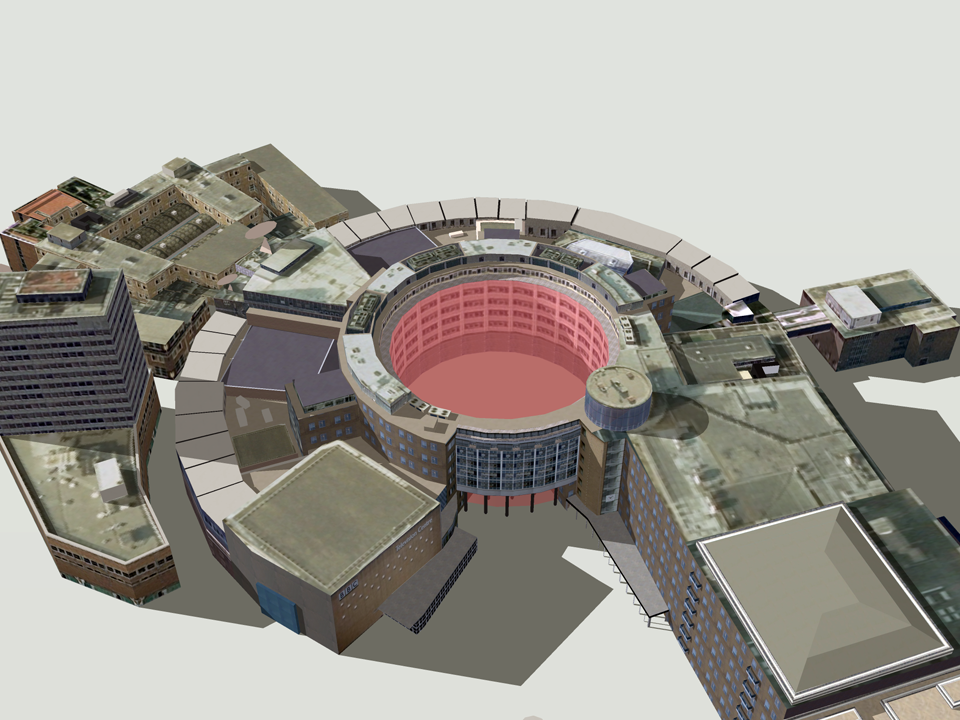
Based on the average rate per production hour for programme emissions, 11 hours of production time would fill the void in the centre of the BBC Television Centre in London - a space that is well-known to production teams.

The carbon footprint of the UK potato

CLIENT

ADAS

PURPOSE

To illustrate their capability to help farmers manage and reduce emissions.

DESCRIPTION

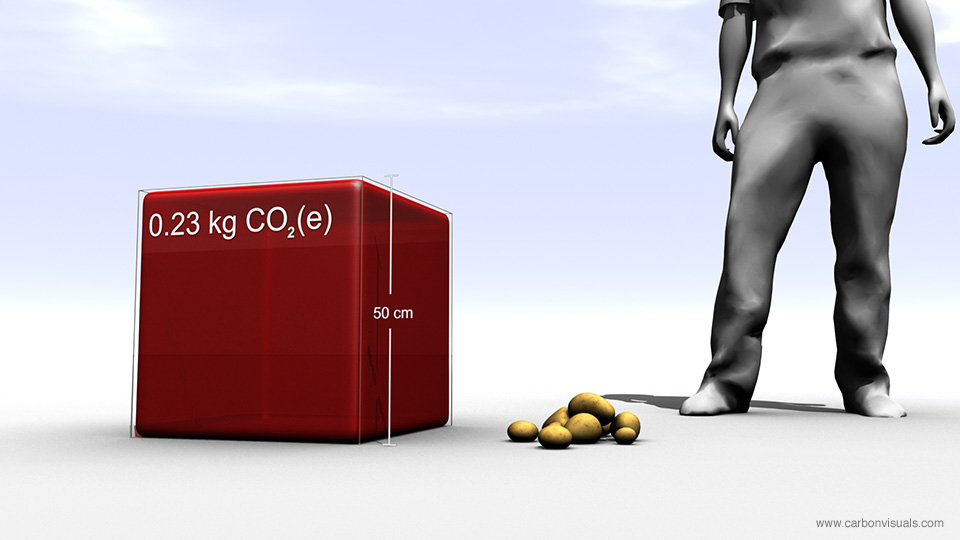
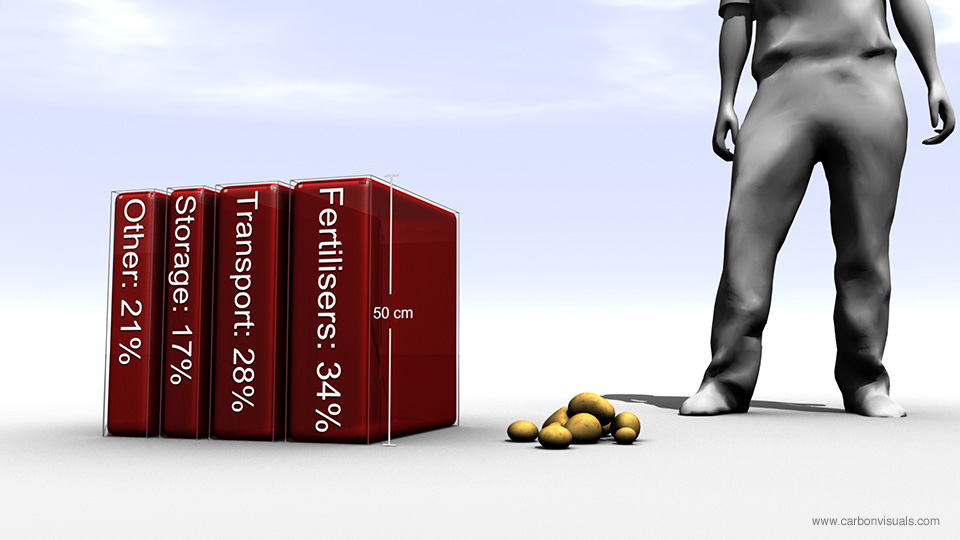
Film that combines live action and animation to explore the carbon footprint of the UK potato at personal and farm scales.

ADAS, the land and farming consultancy, wanted to compliment the earlier film that we made to illustrate emissions, sequestration & stored carbon on upland farms in the Peak District National Park. This time they were keen to illustrate their capabilities in helping mainstream farmers manage and reduce their carbon emissions.

The film explores the carbon footprint of the UK potato at the personal scale, as well as carbon saving potential at the farm scale.

More info from ADAS Carbon Management Team

To see all our work for ADAS, click here.

Carbon Visuals is keen to explore the use of film for helping everyone better understand carbon emissions from everyday activities. Please contact us if you have ideas.


Supporting BP's interactive carbon calculator for motorists


CLIENT

BP

PURPOSE

To encourage motorists reduce emissions from driving.

DESCRIPTION

Consultancy and visuals for a web calculator showing actual volumes of CO2 which change in size as reduction actions are chosen, with image set and methodology.

Carbon Visuals helped newly re-launched BP Target Neutral project by providing consultancy for the web calculator designed to help motorists reduce, replace and offset carbon dioxide from driving. The calculator, aimed at the general public, is the first in the world to show actual volumes of CO2 which change in size as different reduction actions are chosen. In addition carbon spheres can be compared against averages for other countries as well as the UK 'target' reduction for 2050.

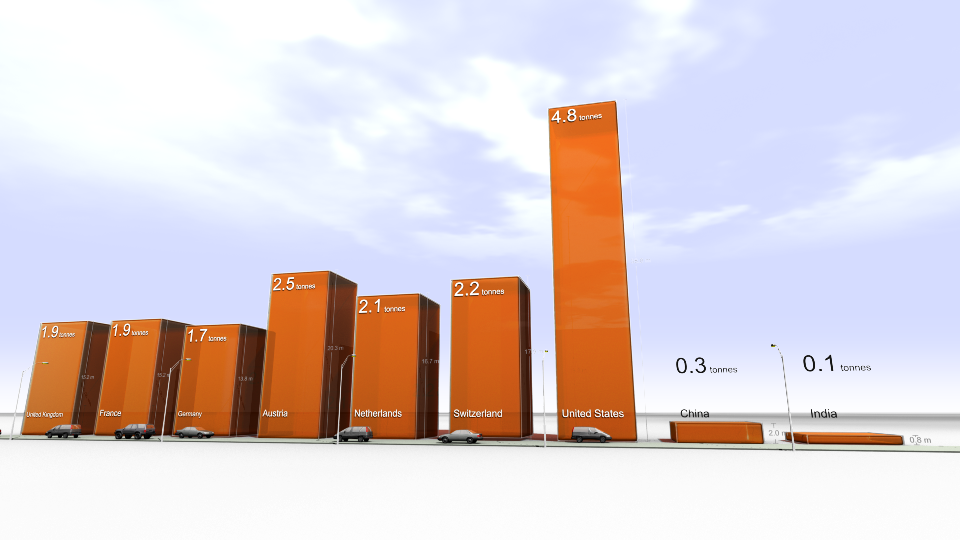
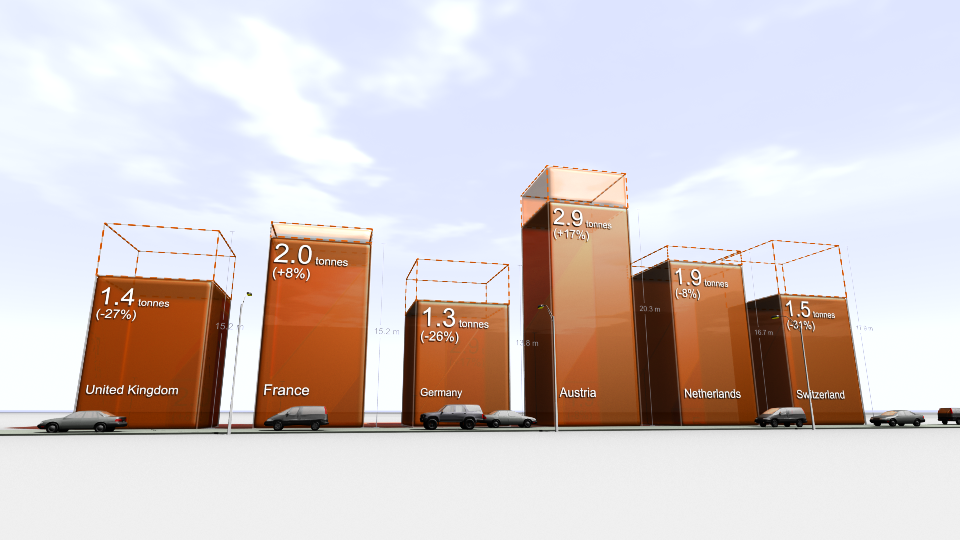
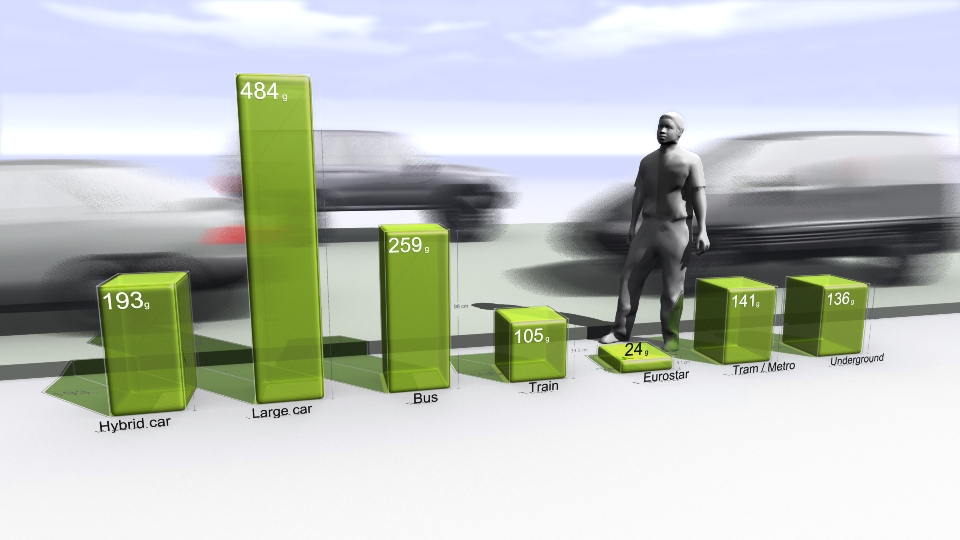
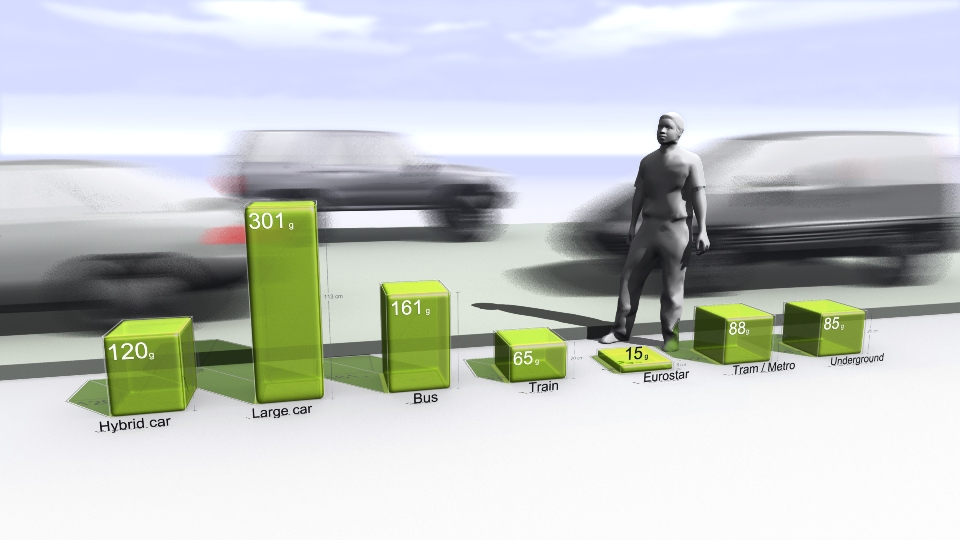
We also provided a number of bespoke images to highlight transport emissions in the UK, emissions of different transport types as well as transport emissions per capita for different countries.

Our Creative Director, Dr Adam Nieman also provided an overview of the importance of carbon visualisation

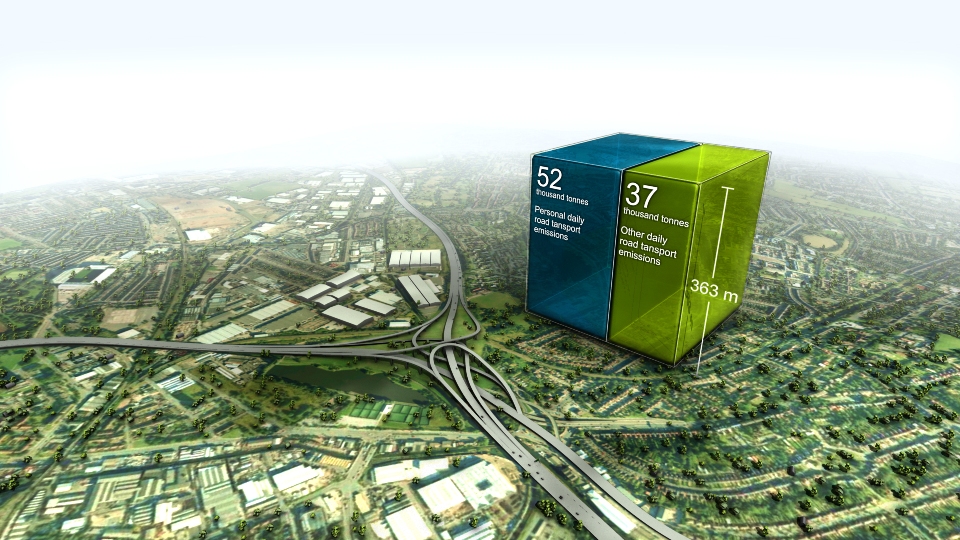
The first visual image uses Spaghetti Junction on the M6 near Birmingham as this basic ground. The familiar image from the British road network makes the immediate point that this is about roads, but then uses the recognisable scale to locate a cube-like shape showing the volume of carbon our cars, lorries and buses put into the atmosphere every day.

The cube presents this visually, while the simple captions fill in the specific details. This, the image is saying, is what 90,000 tonnes of carbon dioxide look like, and that’s what we’re pumping into the atmosphere every day. Suddenly the daily figure is something real and dramatic.

The BP Target Neutral Methodology PDF outlines the data, calculations and assumptions in the image set.


Emissions, sequestration & stored carbon on upland farms

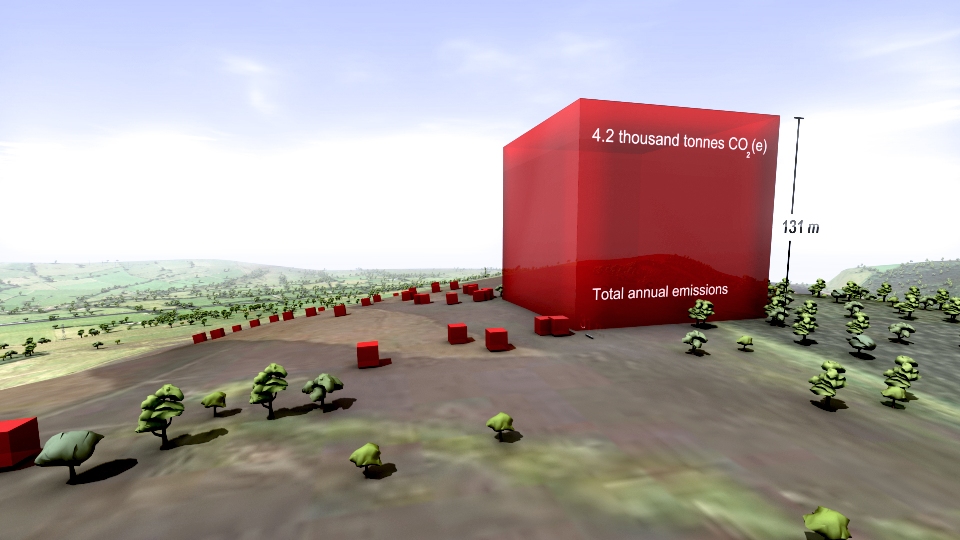
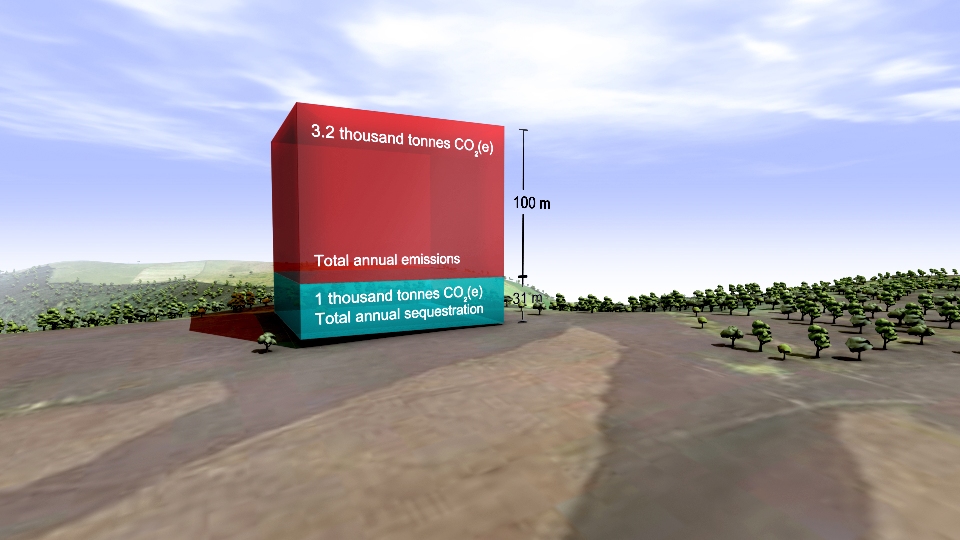
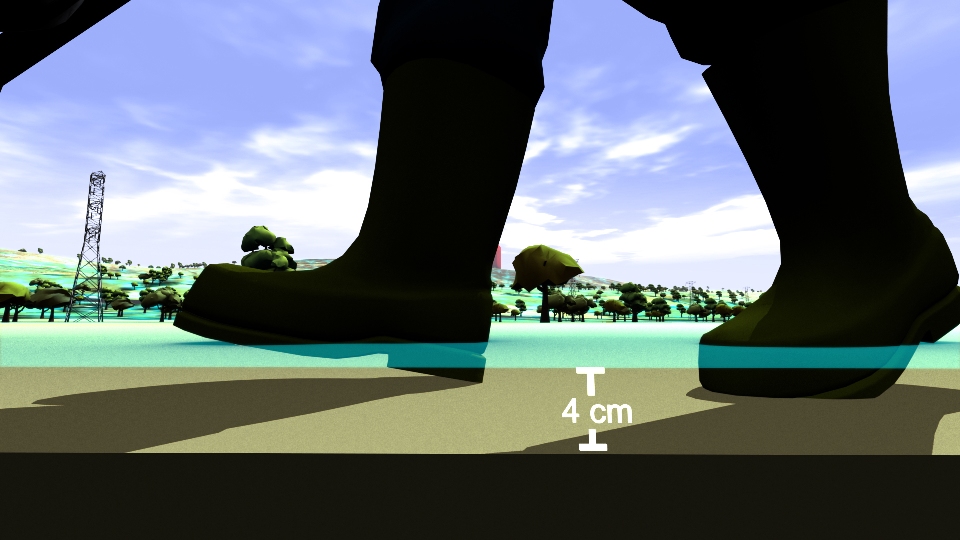
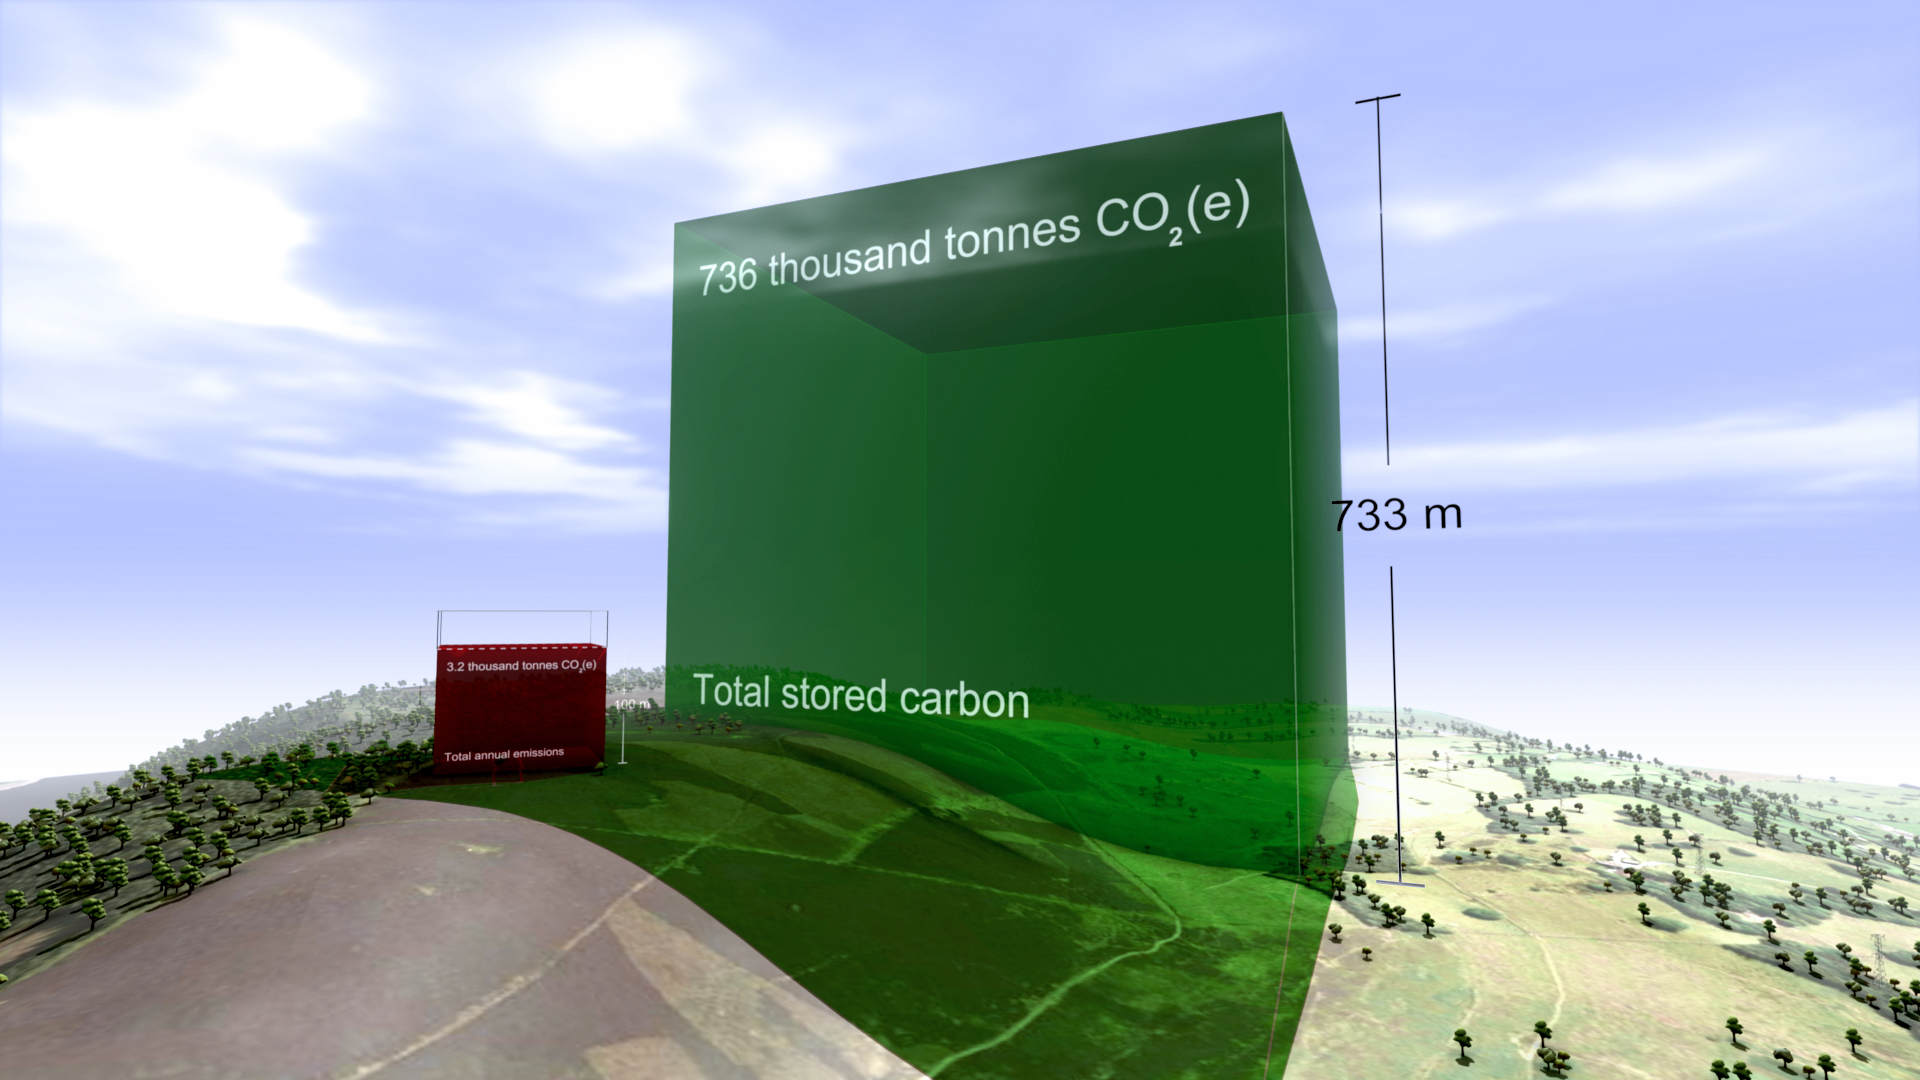
Carbon Visuals have created this short animation film to show the emissions, sequestration & stored carbon on ten upland farms in the Peak District National Park. The farms extend over 1,500 hectares and comprise part moorland, part pasture.

The data was taken from ADAS Report Environmental Quality Mark (EQM) Farm Carbon Footprint and Water Audit Pilot Project.

The core message from the film is that these farms are not only producing food and preserving the landscape. They are performing an important role as guardians of a huge carbon store that is best kept in soils and vegetation.

We believe that this is a 'world first' for this type of medium. Created for the consultancy ADAS, the film demonstrates the potential for moving animation to communicate complex carbon stories.

The film is being used to engage a variety of stakeholders including ADAS staff, farm managers and agricultural policymakers.

To see all our work for ADAS, click here.

If you like this approach, and feel that it would suit your particular carbon communication challenge, then please contact us.


Making sense of a BBC programme's carbon footprint


The One Planet radio programme on the BBC's World Service came to Carbon Visuals with simple question: "what does our carbon footprint look like?"

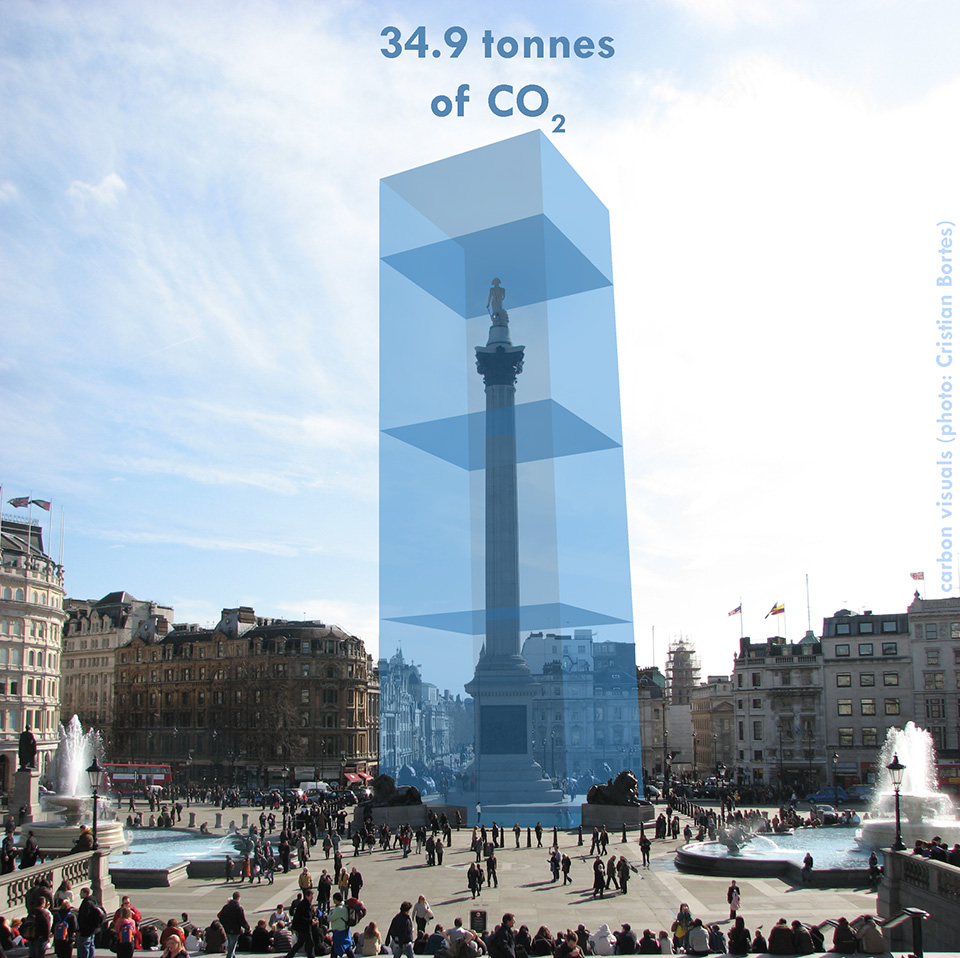
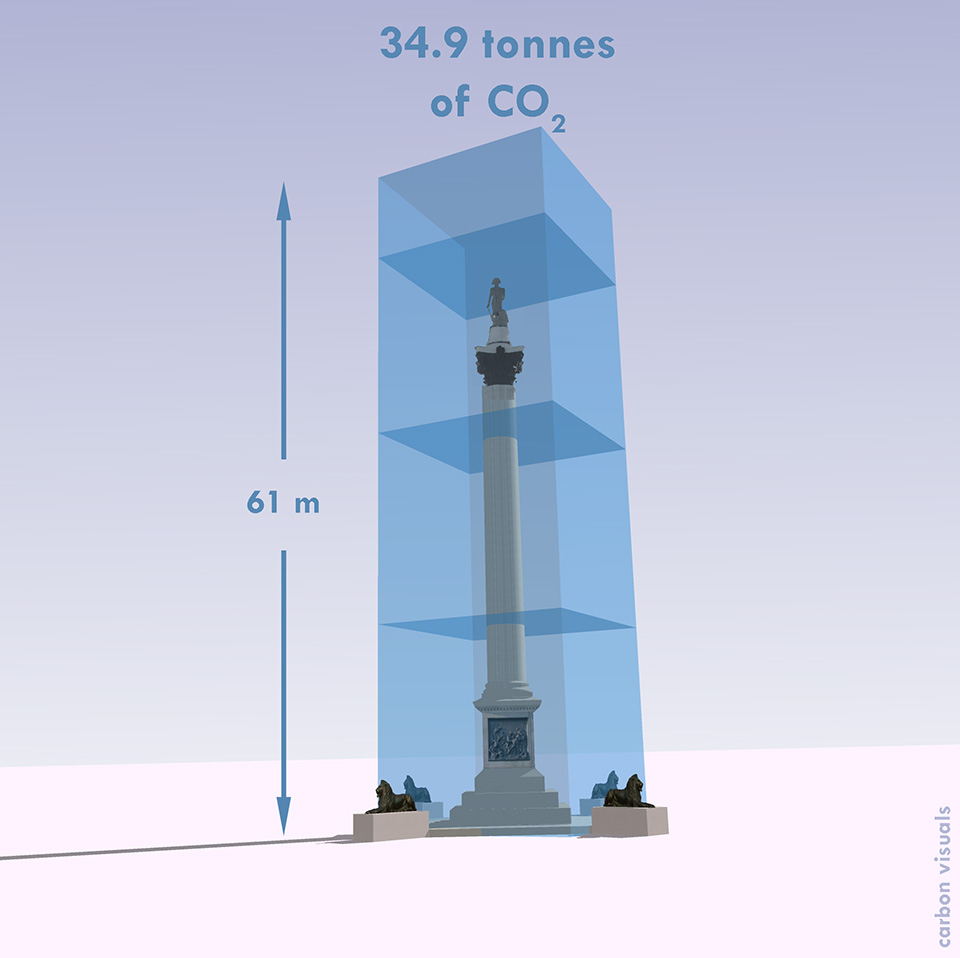
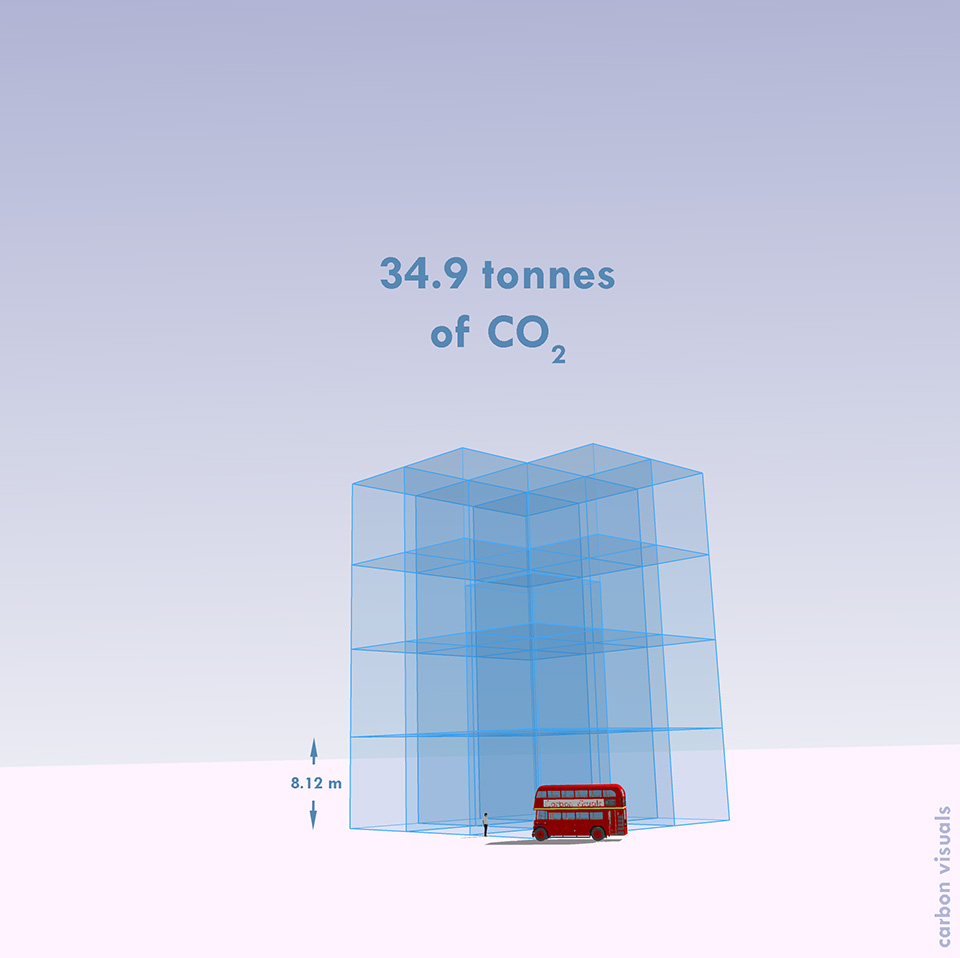
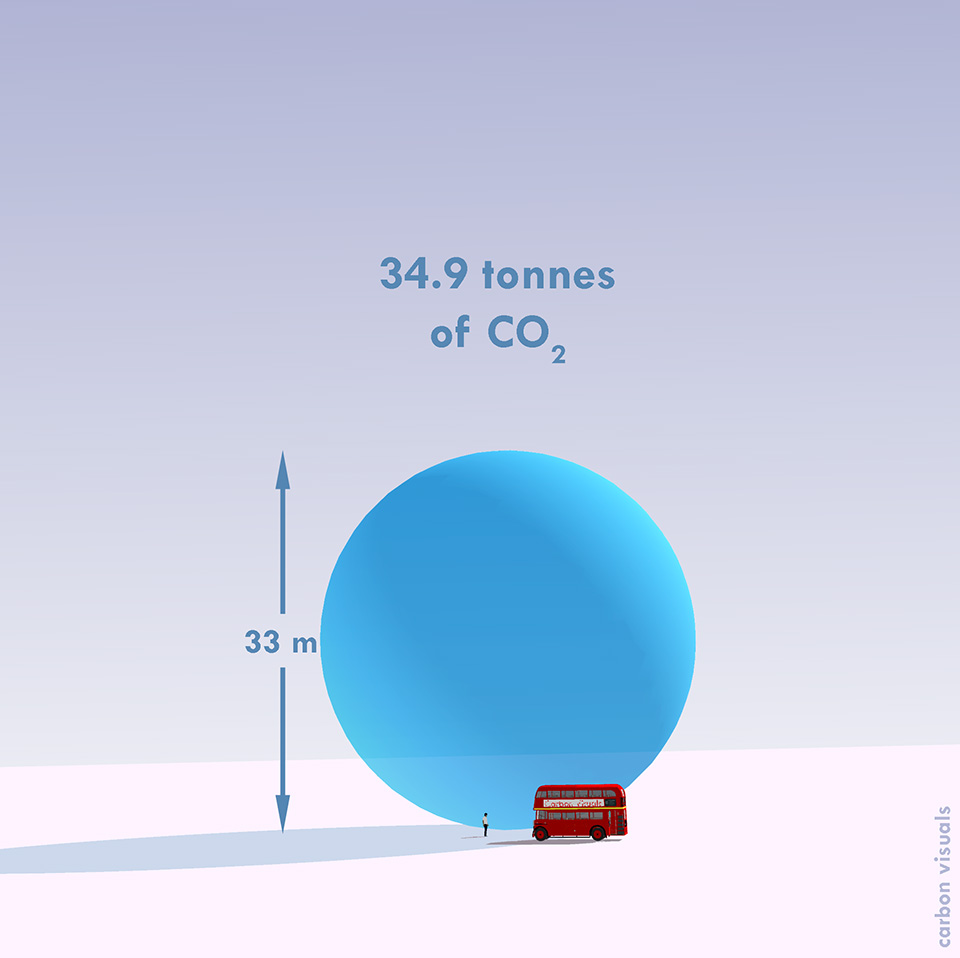
One Planet was carefully accounting for emissions arising from the making of the programme and had arrived at a figure of about 34.9 tonnes per year. But what does that mean?

Measuring carbon dioxide in terms of mass (tonnes) makes sense from an accounting point of view but doesn't give us a sense of scale we can relate to. We examined a variety of alternative ways of representing One Planet's footprint.

We have shown the programme's annual emissions by volume in a recognisable location and in relation to an iconic feature - Trafalgar Square and Nelson's Column. These provide a sense of scale that enable the viewer to relate to the volume.

You can hear a discussion about this project, first broadcast on Thursday 8 April 2010, by visiting the One Planet website.


Showcasing ADAS carbon consultancy capability

ADAS provides environmental solutions, rural development services and policy advice. The company is leading projects on GHG methodologies and mitigation measures for food production and agriculture in the UK.

For both simple and complex foods, the key is to understand the production processes of crops and animals in intensive, extensive and organic production systems.

The company asked Carbon Visuals to provide a series of images to showcase their carbon management consulting capability to the food and agriculture sector.

We created images depicting the carbon footprint of potatoes in relation to the production of school meals in the UK. In addition we provided an animated film showing the emissions, sequestration and stored carbon on ten Peak District farms.

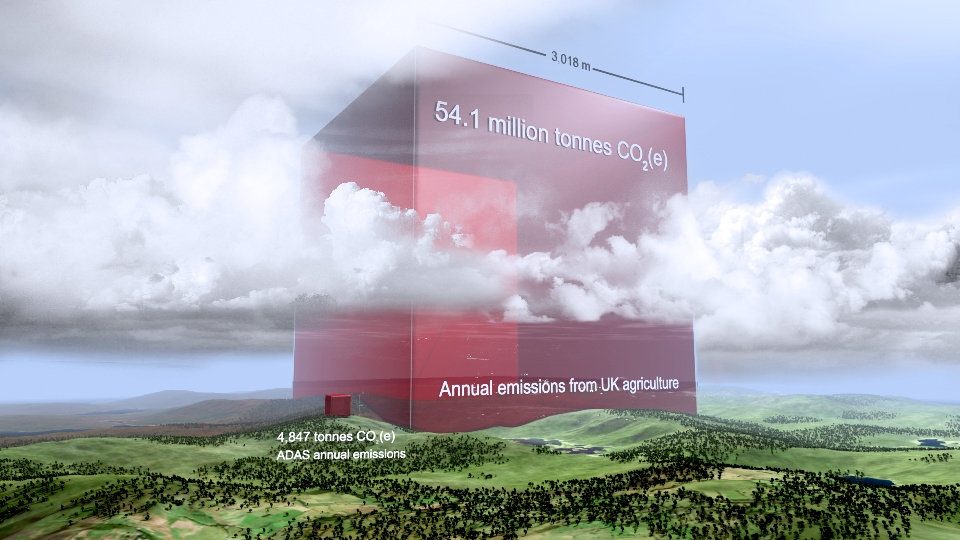
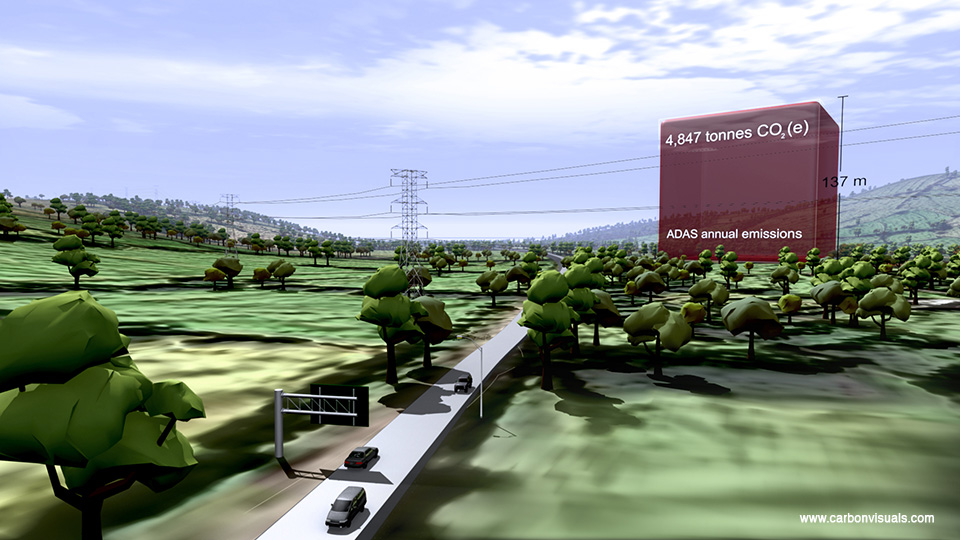
Finally we produced a set of images to show the company's own carbon footprint and their reduction target. This included a comparison with the total emissions from UK agriculture - which they are able to influence through their consultancy practices.


Engaging employees at the Guardian News and Media Group

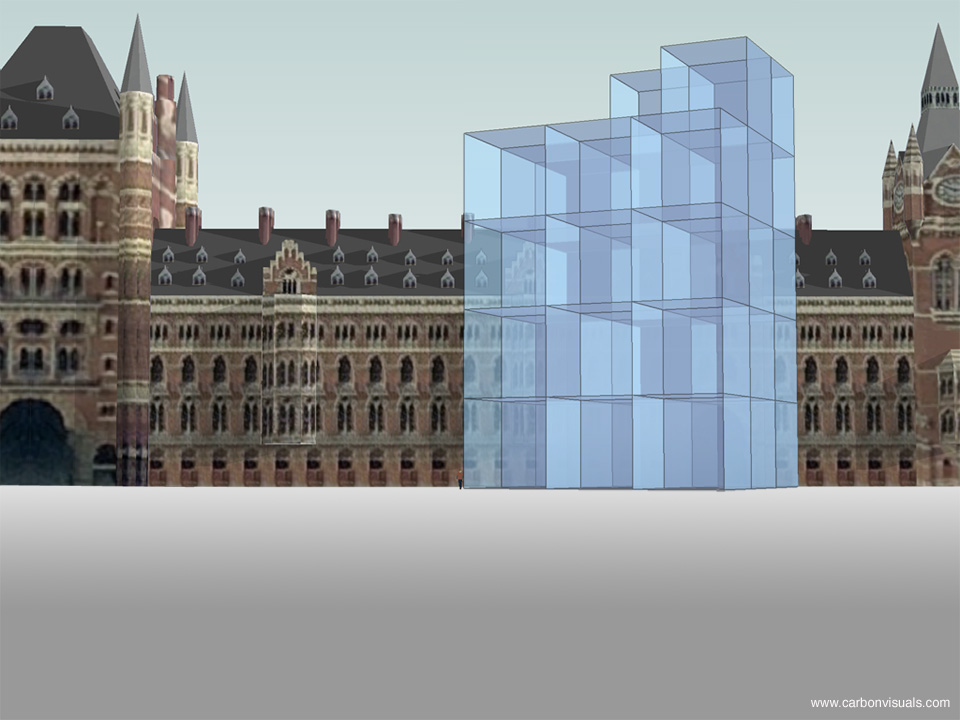
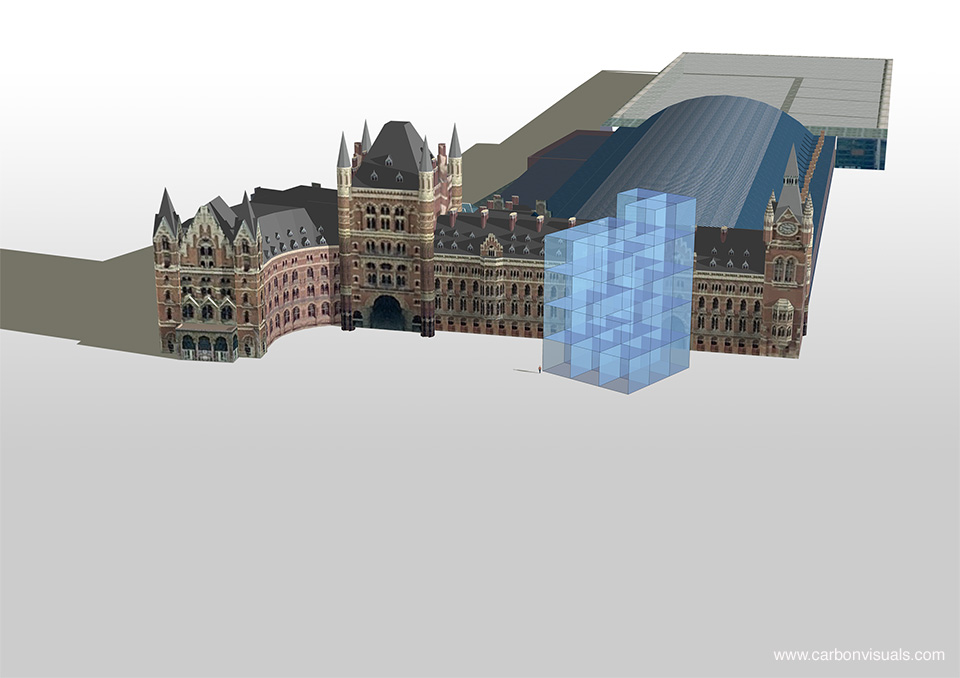
The Guardian News and Media Group turned to Carbon Visuals to get employees involved in reducing the company’s carbon footprint. On an average day between April 2007 and March 2008, GNM emitted 39 tonnes: 20 tonnes from two print sites, 14 tonnes from offices and five tonnes from business travel.

The Guardian offices are near St Pancras Station - a landmark that employees can relate to physically. Viewers can see the picture and know what such a pile of one tonne cubes would be ‘like’.

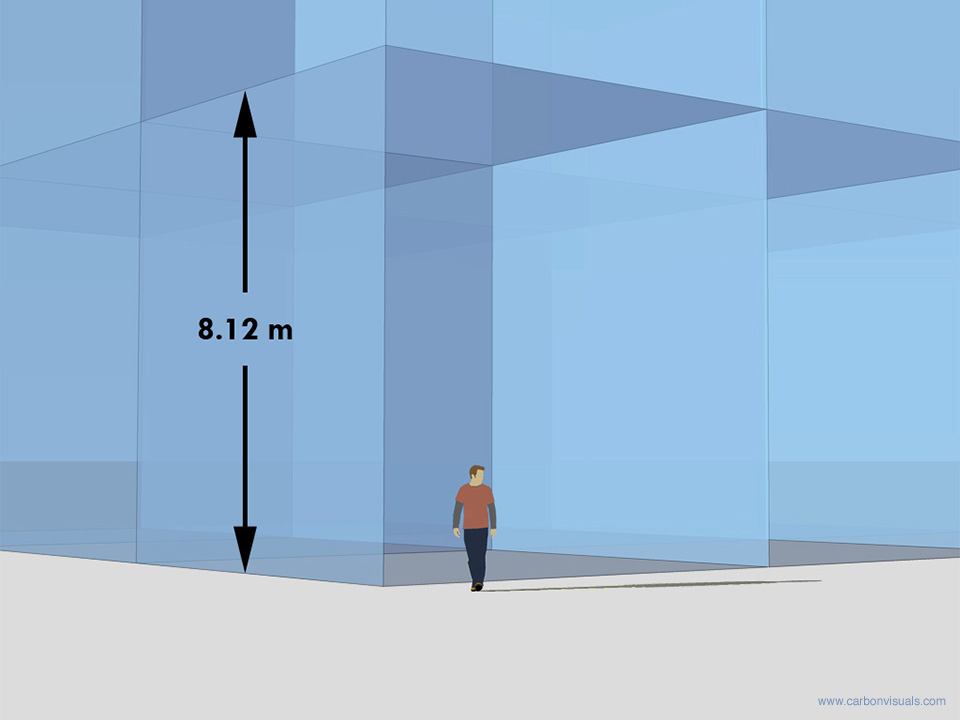
Guardian News and Media's daily carbon dioxide emissions. On an average day between April 2007 and March 2008, GNM emitted 39 tonnes: 20 tonnes from 2 print sites,14 tonnes from the old offices and 5 tonnes from business travel. One tonne of carbon dioxide gas would fill a cube of 8.12 metres high. Viewing the pile of 1-tonne cubes from eye-level can give a viewer a better sense of the height.